
Fig. S1
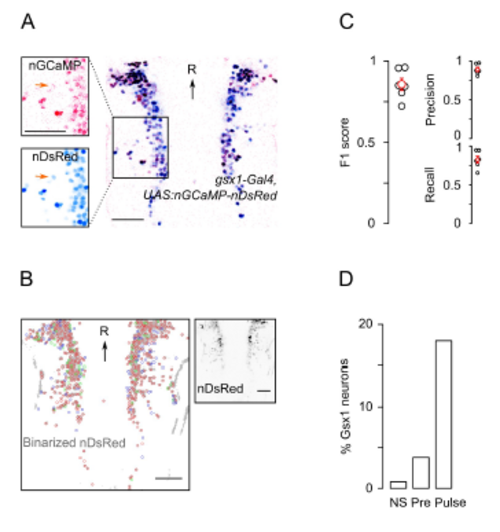
Large-scale calcium imaging of neuronal activity during prepulse inhibition. Related to Figure 1 A. Single horizontal confocal section showing Gsx1 cells expressing both nls-GCaMP6s (pink) and nls-DsRed2 (blue) in the hindbrain of a gsx1-Gal4, UAS:nls-GCaMP6s-2a-nls-DsRed2 larva. Insets are separate color channels. Orange arrows indicate the same cell. R, Rostral. All scale bars 50 μm. B. Automated segmentation of 2-photon images (binarized nls-DsRed2, gray) by seeding at local maximum and temporal correlation showing hits (red), false positives (green) and false negatives (blue) compared with manual segmentation. Inset shows nls-DsRed signal. C. F1 scores, precision and recall measures of automated compared with manual segmentation. n=6 experiments, means (±s.e.m) are red. D. Percent of Gsx1 neurons active during acoustic tests. n=34050 total Gsx1 neurons. No stimulus trial (NS), prepulse alone trial (Pre), pulse alone trial (Pulse). |