
Fig. 7
- ID
- ZDB-FIG-180918-43
- Publication
- Zhang et al., 2018 - UBTOR/KIAA1024 regulates neurite outgrowth and neoplasia through mTOR signaling
- Other Figures
- All Figure Page
- Back to All Figure Page
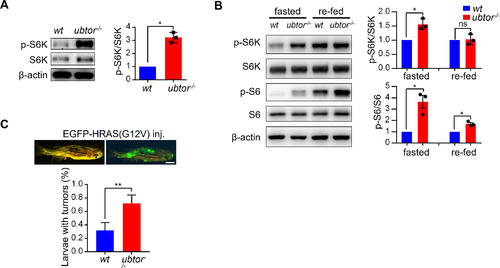
Disruption of ubtor gene increases mTOR signaling in zebrafish brain tissues. (A) Immunoblot analysis of p-S6K levels in wild type (wt) controls and ubtor-/- mutants. The head tissues were isolated from 5 dpf zebrafish before introducing food to fish larvae. For quantitative analysis, the p-S6K/S6K values were normalized to that of wt. t = 9.840, df = 2, P = 0.0102. Representative results from three biological repeats. (B) Immunoblot analysis of mTOR signaling in wt controls and ubtor-/- mutants under fasted and re-fed conditions. Zebrafish larvae of 13.5 dpf were starved for 36 hours, and then the larvae in the re-fed group were fed for 12 hours. Brain tissues were dissected out from the fasted and the re-fed larvae. For quantitative analysis, the p-S6K/S6K and p-S6/S6 values were normalized to that of wt. For p-S6K/S6K, t = 5.089, df = 2, P = 0.0385 under the fasted condition. For p-S6/S6, t = 4.637, df = 2, P = 0.0435 under the fasted condition, and t = 6.077, df = 2, P = 0.0260 under the re-fed condition. Representative results from three biological repeats. (C) Dominant-active HRAS(G12V) induced tumor formation in wild type controls (wt) and ubtor mutants. Three and four biological repeats for the wt and the mutant, respectively. t = 4.343, df = 5, P < 0.01. n = 59 and 37 for the wt and the mutant, respectively. χ12 = 13.23, P < 0.001. |
| Antibodies: | |
|---|---|
| Fish: | |
| Conditions: | |
| Anatomical Terms: | |
| Stage Range: | Day 5 to Days 14-20 |
| Fish: | |
|---|---|
| Conditions: | |
| Observed In: | |
| Stage Range: | Day 5 to Days 14-20 |