
FIGURE
Fig. 3
- ID
- ZDB-FIG-180917-43
- Publication
- Wilding et al., 2018 - Pupil mask diversity for image correction in microscopy
- Other Figures
- All Figure Page
- Back to All Figure Page
Fig. 3
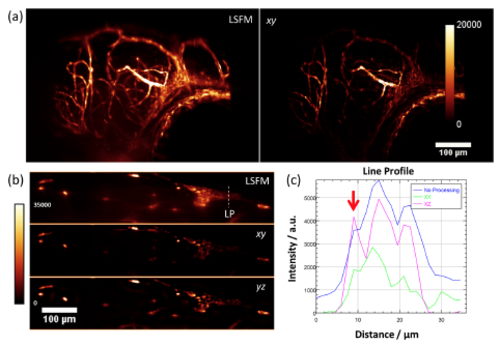
(a) A xy maximum intensity projection of the three-dimensional dataset of the zebrafish larvae head with the standard LSFM (8 datasets) and the diversity processed set plane-by-plane in the xy direction. (b) A slice through the zebrafish in the yz-plane showing the comparison between xy processing and yz processing. (c) A plot of the line profile in (b). All images are normalised to a 16-bit range minimum to maximum with the colour-scale as shown. |
Expression Data
Expression Detail
Antibody Labeling
Phenotype Data
Phenotype Detail
Acknowledgments
This image is the copyrighted work of the attributed author or publisher, and
ZFIN has permission only to display this image to its users.
Additional permissions should be obtained from the applicable author or publisher of the image.
Full text @ Opt. Express