
Fig. 6
- ID
- ZDB-FIG-180914-9
- Publication
- Matejčić et al., 2018 - A non-cell-autonomous actin redistribution enables isotropic retinal growth
- Other Figures
- All Figure Page
- Back to All Figure Page
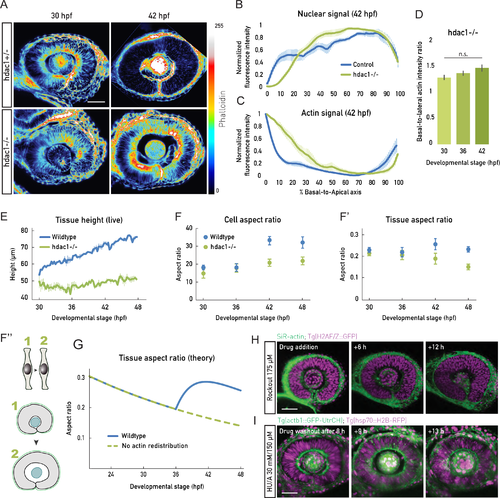
Actin redistribution enables cell elongation in concert with cell proliferation. (A) Phalloidin signal before (30 hpf) and after (42 hpf) actin redistribution in the heterozygous (hdac1+/−) controls and hdac1−/− samples. Basolateral actin accumulation does not redistribute in hdac1−/− samples (bottom panels). Lookup table indicates minimal and maximal phalloidin signal values. (B), (C) Normalized average intensity distributions of DRAQ5 (B) and phalloidin (C) signal in control (blue) and hdac1−/− (green) samples at 42 hpf. Values in each sample are normalized to minimum and maximum values. Data are shown as mean ± SEM; 3–9 samples/stage. (D) Basal-to-lateral phalloidin signal intensity ratios in hdac1−/− samples; 5 samples/stage. Mean ± SD. Mann-Whitney test, p-value 0.3095. (E) Tissue height measurements from live embryos (light sheet time lapses) for wild-type (blue) and hdac1−/− (green) samples related to S5 Movie). N = 2/condition. (F) Cell shape analyzed as aspect ratios from mean cell cross-sectional area and height in wild-type (blue) and hdac1−/− (green) samples; 3–10 samples/stage. Wild-type data same as in Fig 2E. (F’) Tissue shape analyzed as aspect ratios from mean tissue area and height in wild-type (blue) and hdac1−/− (green) samples; 3–10 samples/stage. Wild-type data same as in Fig 2E. (F”) Schematic representation of the unchanged cell aspect ratio during hdac1−/− retinal PSE growth and perturbed tissue shape. Related to S5 Movie. (G) Prediction of simplified theory for the tissue aspect ratio |