
Fig. 7
- ID
- ZDB-FIG-180911-38
- Publication
- Muralidharan et al., 2018 - Retinal Wnt signaling defect in a zebrafish fetal alcohol spectrum disorder model
- Other Figures
- All Figure Page
- Back to All Figure Page
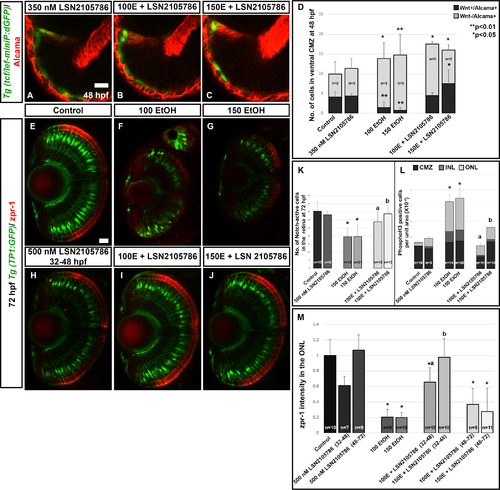
Wnt agonist treatment rescues ethanol-induced retinal cell differentiation defects. (A-C) Treatment with 350 nM GSK3β inhibitor (LSN 2105786) showed a rescue of Wnt+ cells in the peripheral CMZ, which were reduced after ethanol treatment. Control and ethanol treated embryos in this experiment appeared identical to those shown in Fig 4A–4C and were left out for brevity. (D) Quantification of Wnt+/Alcama+ and Wnt-/Alcama+ cells in the peripheral CMZ. (E-J) Treatment with LSN 2105786 on Tg(TP1:GFP) fish showed rescue of Notch signaling after LSN 2105786 treatment. Ethanol treated fish show reduced notch-activity (green) and photoreceptor terminal differentiation marker expression (zpr-1, red), which was restored by LSN 2105786 treatment. (K) Quantification of mCherry-positive, Notch-active cells per optic nerve containing optical section, in the retina showed a significant rescue of notch signaling after LSN 2105786 treatment. (L) Quantification of phosphoH3-positive cells in the retina showed a significant rescue of cell proliferation response after LSN 2105786 treatment at 72 hpf. (M) Quantification of total zpr-1 intensity in the ONL of the retina showed a significant decrease in photoreceptor marker expression after ethanol treatment (2–24 hpf) and subsequent rescue by LSN 2105786 treatment from 32–48 hpf. 100E+ LSN 2105786, and 150E+ LSN 2105786 indicates 100 mM and 150 mM ethanol exposed embryos treated with LSN 2105786, respectively. Images show rostral at top, lateral at left. Error bars indicate standard deviation. ‘**’ indicates statistical significance in comparison to control embryos (p<0.01). ‘*’ indicates statistical significance in comparison to control embryos (p<0.05). ‘a’ indicates statistical significance in comparison to 100 mM ethanol embryos (p<0.05). ‘b’ indicates statistical significance in comparison to 150 mM ethanol embryos (p<0.05). Scale bar = 10 μm for panels A-C. Scale bar = 10 μm for panels E-J. |
| Antibody: | |
|---|---|
| Fish: | |
| Conditions: | |
| Anatomical Term: | |
| Stage: | Protruding-mouth |
| Fish: | |
|---|---|
| Conditions: | |
| Observed In: | |
| Stage: | Protruding-mouth |