
FIGURE
Fig. 5
- ID
- ZDB-FIG-180823-37
- Publication
- Power et al., 2018 - Adaptable, illumination patterning light sheet microscopy
- Other Figures
- All Figure Page
- Back to All Figure Page
Fig. 5
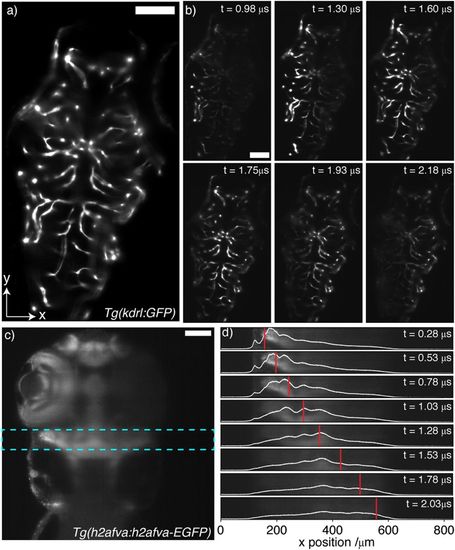
Illumination patterning in live zebrafish larvae (42% TAG amplitude). Scale bars = 100 μm. (a,b) Tg(kdrl:GFP) zebrafish (5 dpf), (c,d): Tg(h2afva:h2afva-EGFP) (5 dpf). (a) Fully illuminated plane through head and trunk section. (b) Patterning along x by phase-delayed illumination pulsing. (c) Fully illuminated plane through head and trunk section. Cyan box corresponds to ROI for (d). (d) Patterning along x by phase-delayed illumination pulsing. White line shows y-averaged illumination intensity. Red line shows position of beam focus for calibration performed in fluorescent dye solution. |
Expression Data
Expression Detail
Antibody Labeling
Phenotype Data
Phenotype Detail
Acknowledgments
This image is the copyrighted work of the attributed author or publisher, and
ZFIN has permission only to display this image to its users.
Additional permissions should be obtained from the applicable author or publisher of the image.
Full text @ Sci. Rep.