
Fig. S8
- ID
- ZDB-FIG-180822-29
- Publication
- Pinto et al., 2018 - Identification of Dmrt2a downstream genes during zebrafish early development using a timely controlled approach
- Other Figures
- All Figure Page
- Back to All Figure Page
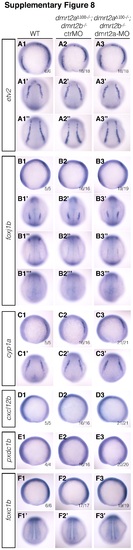
dmrt2a-MO is specific for the validated genes. A1-F3’ In situ hybridisation results depicting the six genes validated in this work. A1-A3” etv2 expression pattern in wildtype embryos (A1-A1”), in dmrt2a Δ100−/− ;dmrt2b −/− embryos injected with ctrMO (A2-A2”) and dmrt2a-MO (A3-A3”). B1-B3”’ foxj1b expression pattern in wildtype embryos (B1-B1”’), in dmrt2a Δ100−/− ;dmrt2b −/− embryos injected with ctrMO (B2-B2”’) and dmrt2a-MO (B3-B3”’). C1-C3’ cyp1a expression pattern in wildtype embryos (C1, C1’), in dmrt2a Δ100−/− ;dmrt2b −/− embryos injected with ctrMO (C2, C2’) and dmrt2a-MO (C3, C3’). D1-D3 cxcl12b expression pattern in wildtype embryos (D1), in dmrt2a Δ100−/− ;dmrt2b −/− embryos injected with ctrMO (D2) and dmrt2a-MO (D3). E1-E3 pxdc1b expression pattern in wildtype embryos (E1), in dmrt2a Δ100−/− ;dmrt2b −/− embryos injected with ctrMO (E2) and dmrt2a-MO (E3). F1-F3’ foxc1b expression pattern in wildtype embryos (F1, F1’), in dmrt2a Δ100−/− ;dmrt2b −/− embryos injected with ctrMO (F2, F2’) and dmrt2a-MO (F3, F3’). We did not observe obvious differences between the three different conditions evaluated. All embryos were collected between 3 and 4-somite stage. (A1-A3, B1-B3, C1-C3, D1-D3, E1-E3, F1-F3) Lateral view, anterior to the left. (A1’-A3’, B1’-B3’) Dorsal-anterior view, anterior to the top. (A1”-A3”, B1”’-B3”’, C1’-C3’, F1’-F3’) Dorsal-posterior view, anterior to the top. (B1”-B3”) Dorsal-medial view, anterior to the top. ctrMO: control morpholino, WT: wildtype. (TIF 8561 kb) |