
Fig. 1
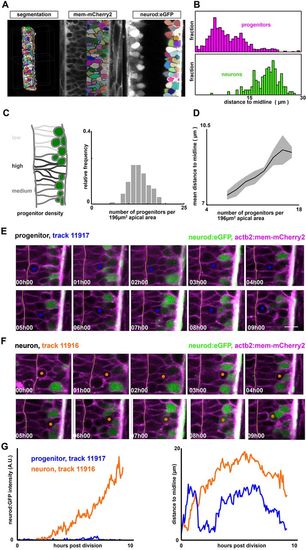
The neural tube is a densely packed and dynamic pseudostratified epithelium. (A) Analysis pipeline: membrane-labeled images are segmented and cropped using custom scripts to generate 3D cell meshes for the entire neural tube. Each mesh is then classified as a neuron or a progenitor, according to the expression level of the neural marker (neurod:eGFP) (see also Fig. S1C). (B) Distance of cell centroid position to the midline, for both progenitors and neurons. (C) Progenitor density (per unit apical area) varies significantly across the neural tube, even at the same dorsal-ventral position. Shown are measurements of progenitor number collected in a 14×14 µm section of apical area collected from different embryos across a range of anterior-posterior positions. (D) Regions of high progenitor density correlate with regions where progenitors are located far from the midline (data are mean±s.e.m.). (E,F) Representative cell tracks from GoFigure2, following two sister cells. (E) A cycling progenitor. Scale bar: 10 µm. (F) A nascent neuron. Orange and blue circles indicate one of the daughter cells from the mitotic cell. Dotted line indicates the midline (apical surface) (see also Movie 1). (G) neurod:eGFP intensity (left) and nuclear position (right) as a function of time for the two cells shown in E,F. |