
Fig. S6
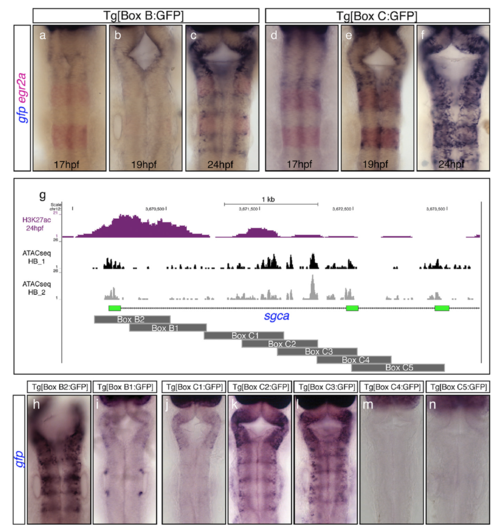
Onset of activity and dissection of the regulatory regions Box B and Box C. (A–F) Double in situ hybridization experiments for gfp (blue) and egr2a (red) in F2 transgenic embryos to reveal the onset of activity of Box B (A–C) and Box C (D–F). Note that the onset of activity of Box B is delayed compared with Box C, suggesting that initiation and maintenance of gene expression might be under the control of different enhancer elements. egr2a expression is used as a landmark for r3 and r5. (G) Active enhancers’ epigenetic profile (H3K27ac; magenta peaks) along with the ATAC-seq signature from dissected hindbrains at 24 hpf (black and gray peaks) are shown in the chromosomal region within the sgca gene that contains both Box B and Box C elements. Box B was dissected into two overlapping fragments (Box B1–B2), and Box C into five overlapping regions (Box C1–C5), as depicted by dark-gray rectangles. (H–N) Stable transgenic lines for each of the fragments displayed in G were generated, and embryos at 24 hpf were assayed for gfp in situ hybridization. Note that Box B2 and Box C2/C3 (but not Boxes B1, C1, C4, and C5) drive gfp expression to the hindbrain boundaries. All images are hindbrain dorsal views with anterior at the top. |
| Gene: | |
|---|---|
| Fish: | |
| Anatomical Term: | |
| Stage Range: | 14-19 somites to Prim-5 |