
FIGURE
Fig. 1
Fig. 1
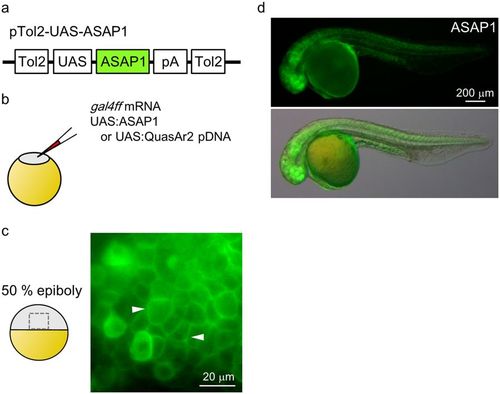
Transient expression of ASAP1. (a) Schematic diagram of plasmid construct for ASPA1. (b) Schematic diagram of the co-injection experiment. (c) ASAP1 was localized to the cellular membranes at 50% epiboly (arrowheads). (d) Lateral views of ASAP1-expressing embryos at 1 dpf. ASAP1 was expressed widely in the embryos. |
Expression Data
Expression Detail
Antibody Labeling
Phenotype Data
Phenotype Detail
Acknowledgments
This image is the copyrighted work of the attributed author or publisher, and
ZFIN has permission only to display this image to its users.
Additional permissions should be obtained from the applicable author or publisher of the image.
Full text @ Sci. Rep.