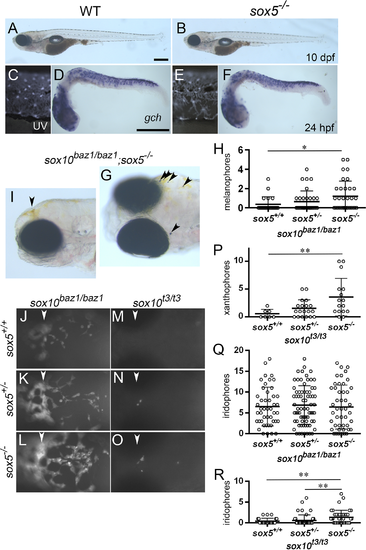
Sox10-mediated pigment cell formation is modulated by Sox5 in zebrafish. (A, B, C, E) Swim bladder inflation stage (10 dpf). Lateral views. (C, E) UV images. (D, F) 24 dpf. Lateral views. (G, I-O) 4 dpf. (G) Dorsolateral view. (I) Lateral view. (J-O) Fluorescing xanthophores. Dorsal views anterior to the left. The sox5 mutant is indistinguishable from WT, exhibiting four stripes of melanocytes (A, B) and having fluorescing xanthophores (C, E) and gch-expressing xanthoblasts (D, F). Melanocytes are almost completely absent from sox10baz1/baz1 mutant (S8B Fig), but are partially recovered in sox10baz1/baz1 mutants that have also lost sox5 WT allele(s) (G, H). The ratio of the embryos without melanocytes or with more than one melanocytes was compared among genotypes by Chi-squared test (*p<0.05). A few xanthophores develop on surface of the head in sox10baz1/baz1 mutant (S8E, S8I and S8J Fig), and reduction of sox5 is likely to elevate xanthophore formation (K, L). Whereas sox10t3/t3 mutant almost completely lacks xanthophores (M), a few xanthophores are rescued as the sox5 WT allele(s) are reduced (N, O). The counts are shown for xanthophores on the t3 background (P). Comparison between the genotypes was performed by Kruskal-Wallis test with SDCF post hoc test. **p<0.05. A substantial number of iridophores are formed in sox10baz1/baz1 mutants (S8G and S8H Fig), and the counts are not significantly altered with reduction of the sox5 WT allele(s) (Q, p = 0.775 by Kruskal-Wallis test). Iridophores are almost completely lost in sox10t3/t3 mutant (S8I Fig), but are partially recovered in sox10t3/t3;sox5+/- and sox10t3/t3;sox5-/- mutants (R **p<0.05 by Kruskal-Wallis test with SDCF post hoc test). (H) sox10baz1/baz1;sox5+/+, n = 22; sox10baz1/baz1;sox5+/-, n = 34; sox10baz1/baz1;sox5-/-, n = 33. (Q) sox10baz1/baz1;sox5+/+, n = 46; sox10baz1/baz1;sox5+/-, n = 73; sox10baz1/baz1;sox5-/-, n = 47. (P) sox10t3/t3;sox5+/+, n = 7; sox10t3/t3;sox5+/-, n = 19; sox10t3/t3;sox5-/-, n = 16. (R) sox10t3/t3;sox5+/+, n = 24; sox10t3/t3;sox5+/-, n = 48; sox10t3/t3;sox5-/-, n = 40. (H, P-R) Bars show mean and error bar (s.d.). Arrowheads point to weakly melanised cells (G) and at the corresponding position of the head (I-O). Scale bars: (A, D) 200 μm.
|
