
FIGURE
Fig. 3
- ID
- ZDB-FIG-180705-42
- Publication
- Bergmann et al., 2018 - Imaging Neuronal Activity in the Optic Tectum of Late Stage Larval Zebrafish
- Other Figures
- All Figure Page
- Back to All Figure Page
Fig. 3
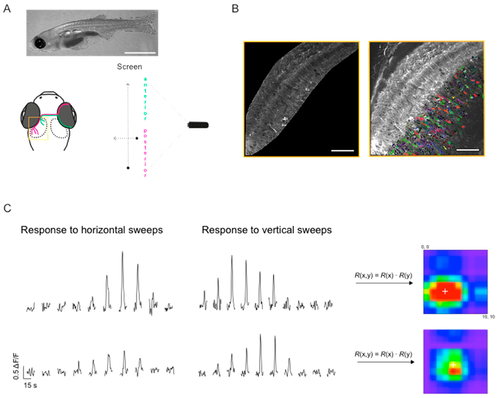
Mapping receptive fields in the optic tectum with small spots. (A) Schematic diagram of the experimental setup for visual stimulation, also illustrating the retinotopic organisation of visual input to the optic tectum: Retinal ganglion cells located in the anterior part (magenta) of the retina, convey information about the posterior part of the visual field and project to the posterior part of the optic tectum and vice versa. Yellow box shows the region imaged in (B). Top—representative image of an 18 dpf larvae (scale bar: 2 mm). (B) Dorsal view of one tectal hemisphere of a transgenic zebrafish larvae (18 dpf) expressing GCaMP3 in both the tectal neuropil (left panel) and cell bodies of PVN neurons (right panel). Confocal time series were analysed either on a voxel-wise basis (neuropil) or on a region of interest (ROI) basis (cell bodies). Cell bodies were randomly colour-coded for better visualisation. (C) Representative ΔF/F traces for two voxels in the neuropil, in response to a small spot moving horizontally and vertically across a 10-by-10 grid on the screen. The stimuli were presented in a pseudo-random order; the response traces shown here were manually sorted for presentation purposes. Responses to vertical and horizontal sweeps were multiplied for each location resulting in the 2D receptive fields (RFs) shown on the right. White cross indicates RF centre as determined by parametric fitting with a bivariate Gaussian distribution. (D) Top: Examples of spatial RFs in the tectal neuropil and cell bodies of PVN neurons, colour-coded to show response amplitudes for each point on a 10-by-10 grid. White cross indicates RF centre as determined by parametric fitting with a bivariate Gaussian distribution. Bottom: 2D RFs fitted with a bivariate Gaussian distribution. Scale bars: 50 μm (fluorescence images), 20 degrees (RFs).
|
Expression Data
Expression Detail
Antibody Labeling
Phenotype Data
Phenotype Detail
Acknowledgments
This image is the copyrighted work of the attributed author or publisher, and
ZFIN has permission only to display this image to its users.
Additional permissions should be obtained from the applicable author or publisher of the image.
Full text @ J Dev Biol