
Fig. 2
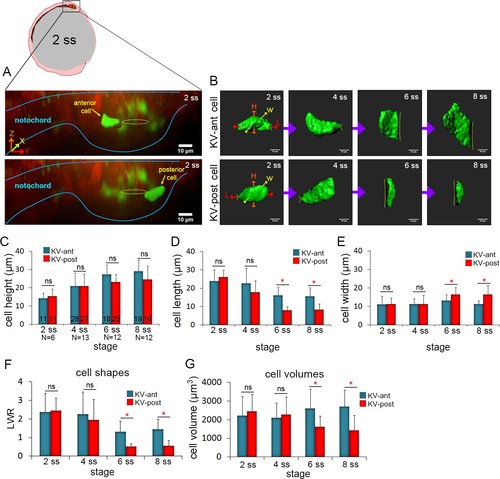
3D morphometric analysis of single cells reveals asymmetric cell volume changes during asymmetric KV cell shape changes. (A) A lateral view of a mosaic labeled KV in a Tg(sox17:CreERT2); Tg(ubi:Zebrabow) at 2 ss. The embryo diagram represents the orientation of the image. The notochord and KV are outlined in blue. Yellow lines mark the KV lumen. Examples of 3D reconstructed KV-ant and KV-post cells along the middle plane of KV are shown. Scale = 10 μm. (B) Representative snapshots of 3D rendered KV-ant and KV-post cells at different stages of KV development between 2 ss and 8 ss. The parameters including height (H), length (L) and width (W) were used to quantify cell morphology. Yellow lines indicate the KV luminal surface. Scale = 10 μm. (C–E) Quantification of height (C), length (D) and width (E) of individual KV-ant and KV-post cells during development. (F) A length-to-width ratio (LWR) was used to describe KV cell shapes. KV-ant and KV-post cells change shape between 4 ss and 6 ss. (G) Volume measurements of individual KV cells at different stages of development. Similar to cell shapes, KV-ant and KV-post cells change volume between 4 ss and 6 ss. All measurements presented in C-G were made on the same group of reconstructed cells. The number of KV-ant and KV-post cells analyzed is indicated in the graph in C. N = number of embryos analyzed at each stage. Graphs show the mean + SD. Results were pooled from three independent experiments. *p<0.01 and ns = not significant (p>5% with Welch’s T-Test). |
| Genes: | |
|---|---|
| Fish: | |
| Condition: | |
| Anatomical Terms: | |
| Stage Range: | 1-4 somites to 5-9 somites |