
Fig. 3
- ID
- ZDB-FIG-180517-1
- Publication
- Shen et al., 2018 - A genetically encoded Ca2+ indicator based on circularly permutated sea anemone red fluorescent protein eqFP578.
- Other Figures
- All Figure Page
- Back to All Figure Page
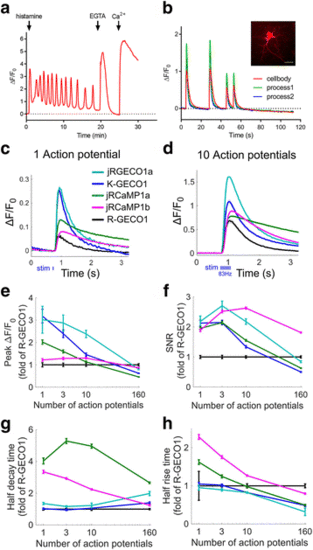
Performance of K-GECO1 in HeLa cells and cultured dissociated neurons. a Representative fluorescence time-course traces for HeLa cells expressing K-GECO1 with pharmacologically induced Ca2+ changes. b Imaging of spontaneous Ca2+ oscillations in dissociated neurons expressing K-GECO1. Inset: Fluorescence image of dissociated neurons expressing K-GECO1 (scale bar, 30 μm). c Average responses for one action potential for K-GECO1 compared with other red GECIs (the same color code is used in panels c–h). d Responses of ten action potentials of red GECIs. e–h Comparison of K-GECO1 and other red GECIs as a function of number of action potentials. e Response amplitude, ΔF/F0. f Signal-to-noise ratio (SNR). g Half decay time. h Half rise time. For (e–h), n = 56 wells, 827 neurons for K-GECO1; n = 66 wells, 1029 neurons for R-GECO1; n = 38 wells, 682 neurons for jRGECO1a; n = 105 wells, 2420 neurons for jRCaMP1a; n = 94 wells, 2995 neurons for jRCaMP1b. Supporting numeric data are provided in Additional file 9. GECI genetically encoded Ca2+ indicator, SNR signal-to-noise ratio |