
Fig. 2
- ID
- ZDB-FIG-180424-1
- Publication
- Balasanyan et al., 2017 - Structure and Function of an Actin-Based Filter in the Proximal Axon
- Other Figures
- All Figure Page
- Back to All Figure Page
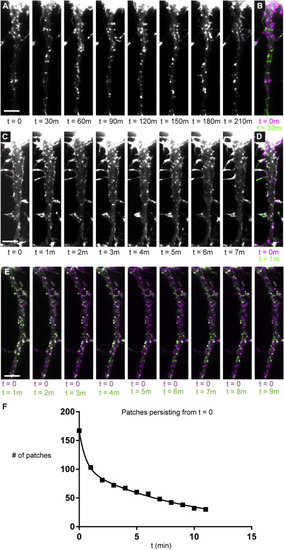
Actin Patches Are Dynamic (A) A series of time-lapse images of the proximal axon of a cortical neuron expressing GFP-Utr taken 30 min apart. (B) Merge of the images at t = 0 (purple) and t = 30 min (green). White puncta represent patches that have persisted, purple puncta represent patches that have disappeared or moved from that location, and green puncta represent patches that have appeared or moved to that location. (C) Images similar to those in (A) taken 1 min apart. (D) Merge of images from (C) at t = 0 (purple) and t = 1 min (green). (E) Merge of timelapse images of GFP-Utr at t = 0 (purple) and t = 1 to 9 min (green). (F) Graph of the number of patches that have persisted from t = 0 over time. Solid line corresponds to the fit of 2 exponentials, tau 1 = 0.7 ± 0.1 min; tau 2 = 6.5 ± 0.4 min; R2 = 0.9979. Roughly 40% of patches have kinetics corresponding to the shorter tau; the rest have kinetics corresponding to the longer tau. Results are a compilation of data from 3 neurons and 3 separate cultures. Scale bars, 5 μm. See also Figure S3 and Movies S3, S4, S5, and S6. |