
Fig. 3
- ID
- ZDB-FIG-180403-14
- Publication
- Frank et al., 2017 - Transcriptomic profiling of mTOR and ryanodine receptor signaling molecules in developing zebrafish in the absence and presence of PCB 95
- Other Figures
- All Figure Page
- Back to All Figure Page
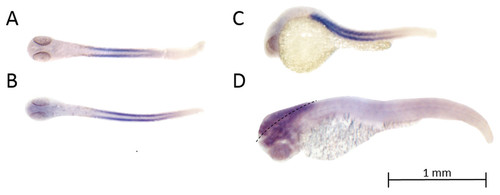
Spatial expression patterns of ryr3 transcripts as determined by in situ hybridization. To obtain dorsal views, the yolk sac was removed prior to imaging. (A) Dorsal view of ryr3 expression at 24 hpf; expression is predominantly in fast twitch muscles and somites. (B) Dorsal view of ryr3 expression at 26 hpf; in addition to expression in fast twitch muscles and somites; ryr3 mRNA is expressed in the hindbrain and telencephalon. (C) Lateral view of ryr3 expression at 26 hpf. Transcripts for ryr3 are present in the whole organism with higher intensity in the telencephalon and habenula. (D) Dorsolateral view of ryr3 expression at 72 hpf, to specially highlight expression in the brain. Transcripts for ryr3 are detected in fast twitch muscles and somites, but are more abundantly expressed in the hindbrain and telencephalon. The dotted line highlights the mid-line of the brain (from a dorsal view). |