
FIGURE
Fig. s1
- ID
- ZDB-FIG-180328-7
- Publication
- Dueñas et al., 2017 - 3D MALDI Mass Spectrometry Imaging of a Single Cell: Spatial Mapping of Lipids in the Embryonic Development of Zebrafish
- Other Figures
- All Figure Page
- Back to All Figure Page
Fig. s1
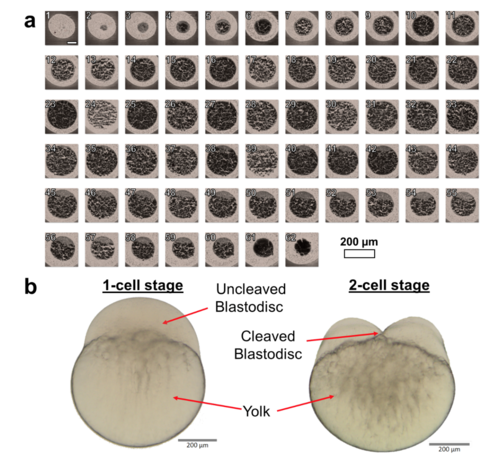
(a) Bright-field images of serial cryo-sections of entire fertilized zebrafish embryo (Danio rerio) at the one-cell stage. The order of the sections is notated at the top left hand corner of each image. (b) Bright-field images of intact zebrafish embryos with the blastodisc, cleavage and yolk labeled. |
Expression Data
Expression Detail
Antibody Labeling
Phenotype Data
Phenotype Detail
Acknowledgments
This image is the copyrighted work of the attributed author or publisher, and
ZFIN has permission only to display this image to its users.
Additional permissions should be obtained from the applicable author or publisher of the image.
Full text @ Sci. Rep.