
FIGURE
Fig. S6
- ID
- ZDB-FIG-180227-7
- Publication
- Fior et al., 2017 - Single-cell functional and chemosensitive profiling of combinatorial colorectal therapy in zebrafish xenografts
- Other Figures
- All Figure Page
- Back to All Figure Page
Fig. S6
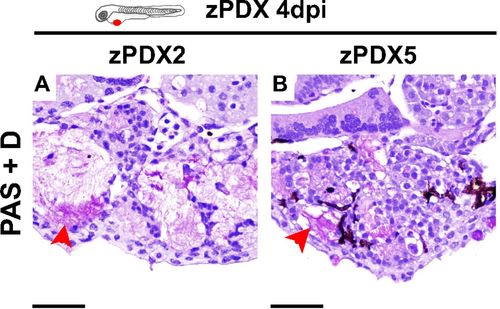
PAS+D staining of zPDX sections. Representative microphotographs zPDX tumors derived from patient#2 (A) and patient#5 (B) at 4 dpi; red arrows depict mucin content within glandular structures by PAS+D staining. (Scale bar, 50 μm.) Note that a fine line of agarose inclusion might be detected around the xenograft due to the agarose embedding step prior to paraffin inclusion. |
Expression Data
Expression Detail
Antibody Labeling
Phenotype Data
Phenotype Detail
Acknowledgments
This image is the copyrighted work of the attributed author or publisher, and
ZFIN has permission only to display this image to its users.
Additional permissions should be obtained from the applicable author or publisher of the image.
Full text @ Proc. Natl. Acad. Sci. USA