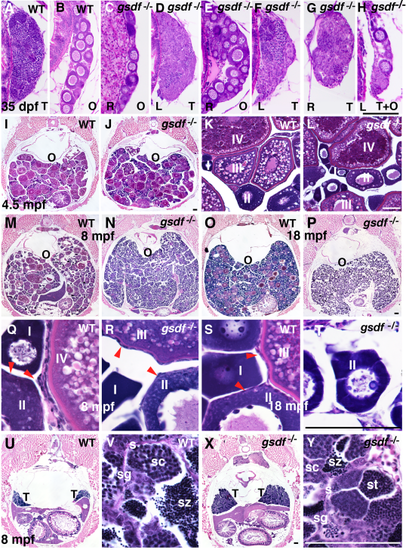
Gonad histology. A–H: Histological sections of 35 dpf wild-type fish showed only ovary or testis (A,B), but six of 22 gsdf mutant fish (27%) at 35 dpf contained either one ovary and one testis, like the two fish in C–F, or individual gonads containing both ovary and testis like the one fish in G and H. O, ovary; T, testis; R, right gonad; L, left gonad. I–T: Adult female ovaries showing low (I,J,M–P), and high (K,L,Q–T) magnification. Cross-sections of 4.5 mpf of wild-types (I,K) and gsdf mutants (J,L) that contained maturing (stage-I, II) and vitellogenic (stage-III and -IV) follicles. The 8-mpf-old wild-type females had gonads filled with maturing (stage-I, -II) and vitellogenic (stage-III and -IV) follicles (M,Q), as well as follicle cells on the surface of oocytes (red arrow heads in panel Q). N,R: Cross-sections of an 8 mpf gsdf mutant female showed an excess of immature follicles (stage-I and -II), a few early vitellogenic follicles (stage-III), but no late vitellogenic follicles (stage-IV). Follicle cells surround oocytes (red arrow heads, panel R) in mutants as in wild-types. (M,Q). Cross section of an old (18 mpf) female wild-type with many immature follicles, a few normal vitellogenic follicles (O,S), and an 18 mpf female gsdf mutant female with many young follicles (stage-I and -II) but no mature stages (P,T). U,V,X,Y: Cross-sections of 8 mpf wild-type (U,V) and gsdf mutant (X,Y) males at low (U,X) and high magnification (V,Y). Although male gsdf mutants had larger testes than wild-types, both genotypes formed all spermatogenic stages O, ovary; s, sertoli cells; sc, spermatocytes; sg, spermatogonia; st, spermatids; sz, spermatozoa; T, testis. Black scale bar in H for A–H; black scale bar in J for I, J; white scale bar in L for K, L; black scale bar in P for M–P; Black scale bar in T for Q–T; black scale bar in X for U, X; white scale bar in Y for V, Y. All scale bars = 100 μm.
|
