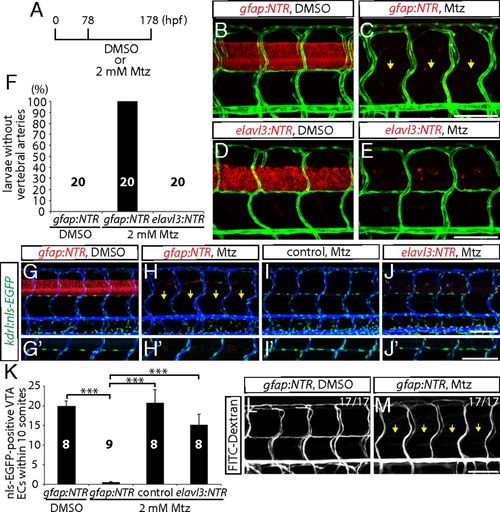
Genetic ablation of CNS radial glia in early larval stages leads to a complete loss of the VTAs. (A) Experimental time course for B–E, G–J, L, and M. (B–E) 178 hpf Tg(gfap:NTR) (B and C) and Tg(elavl3:NTR) (D and E) trunk vasculature visualized by Tg(kdrl:EGFP) expression after treatment with DMSO (B and D) or Mtz (C and E). Genetic ablation of radial glia, but not of neurons, leads to the loss of the VTAs (yellow arrows, C). (F) Percentage of larvae without VTAs, as judged by Tg(kdrl:EGFP) expression (10 somites examined per animal). (G–J) 178 hpf Tg(gfap:NTR) (G and H), control (I), and Tg(elavl3:NTR) (J) animals carrying the kdrl:nls-EGFP transgene, which were injected with Q-dot 655 nanocrystals after treatment with DMSO (G) or Mtz (H–J). Radial glia-ablated fish lack ECs in the position of the VTAs (yellow arrows, H). High-magnification images of ECs in the position of the VTAs are shown in G′–J′. (K) Quantification of nls-EGFP+ EC number in the position of the VTAs within 10 somites per animal. Values represent means ± SEM, ***P < 0.001. (L and M) 178 hpf Tg(gfap:NTR) trunk vasculature visualized by FITC-dextran microangiography after treatment with DMSO (L) or Mtz (M). Radial glia ablation leads to a loss of lumenized VTAs (yellow arrows, M). (Scale bar, 100 µm.)
|
