
Fig. 3
- ID
- ZDB-FIG-180119-13
- Publication
- Hou et al., 2017 - Clinico-biological significance of suppressor of cytokine signaling 1 expression in acute myeloid leukemia
- Other Figures
- All Figure Page
- Back to All Figure Page
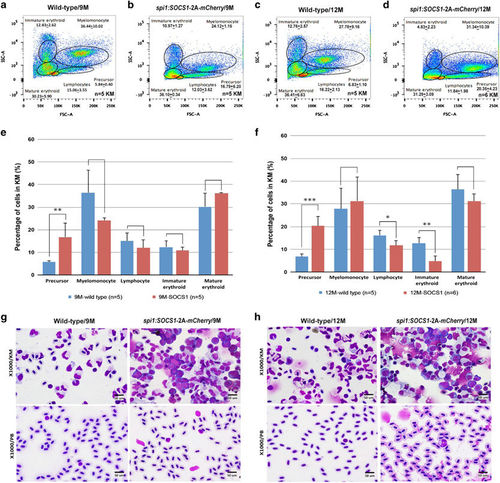
Fluorescence-activated cell sorting analysis and morphological analysis of hematopoietic cells from the kidney marrow or peripheral blood of spi1:SOCS1-2A-mCherry transgenic fish showing increased myelopoiesis with expansion of myeloid precursors at 9 and 12 months of age. (a–d) A total of 30 000 cells from the kidney marrow per animal were analyzed to differentiate various subtypes of hematopoietic cells by flow cytometry. (e and f) The numbers of various subtypes of hematopoietic cells were counted and expressed as mean s.e.m. Gate populations are as follows: immature erythroid, mature erythroid, lymphocytes, myelomonocytes and precursor cells. Mean percentage of cells is indicated for each gated subpopulation. (g and h) Microscopic observation of cytospin smears of the kidney marrow (upper panel) and peripheral blood (lower panel) at 9 months (g) and 12 months (h) showing increased blasts in spi1:SOCS1-2A–mCherry transgenic fish (right), compared with wild-type fish (left). Blasts can be seen in the PB of 12-month transgenic fish (h). Differences among variables were assessed using a Student’s t-test. Significant differences between wild-type and SOCS1 transgenic fish are indicated as follows: *P<0.05; **P<0.01; and ***P<0.001. |
| Fish: | |
|---|---|
| Observed In: | |
| Stage: | Adult |