
FIGURE
Fig. 6
- ID
- ZDB-FIG-171227-30
- Publication
- Eve et al., 2017 - Comparison of Zebrafish tmem88a mutant and morpholino knockdown phenotypes
- Other Figures
- All Figure Page
- Back to All Figure Page
Fig. 6
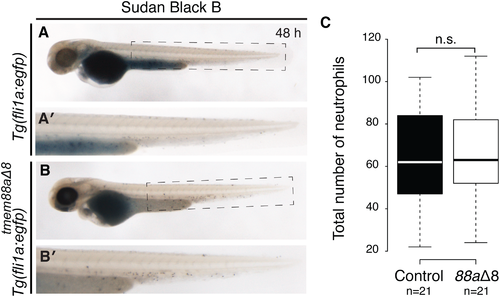
Myelopoiesis was not affected in tmem88aΔ8 zebrafish mutants. (A-B) Sudan Black B staining of neutrophils at 48 hpf in Tg(fli1a:egfp) controls (A, n = 21), with the highlighted tail region magnified (A′) and tmem88aΔ8 mutants (B, n = 21), magnified in (B′). (C) The number of neutrophils was counted for each condition represented in a Tukey box and whisker plot. Neutrophil numbers were not significantly changed between the two groups (p = 0.6769, Unpaired Student’s t test). A, anterior; h, hours post fertilisation; D, dorsal; n.s., not significant. |
Expression Data
Expression Detail
Antibody Labeling
Phenotype Data
| Fish: | |
|---|---|
| Observed In: | |
| Stage: | Long-pec |
Phenotype Detail
Acknowledgments
This image is the copyrighted work of the attributed author or publisher, and
ZFIN has permission only to display this image to its users.
Additional permissions should be obtained from the applicable author or publisher of the image.
Full text @ PLoS One