
FIGURE
Fig. 3
- ID
- ZDB-FIG-171201-22
- Publication
- Vliegenthart et al., 2017 - Characterization of Triptolide-Induced Hepatotoxicity by Imaging and Transcriptomics in a Novel Zebrafish Model
- Other Figures
- All Figure Page
- Back to All Figure Page
Fig. 3
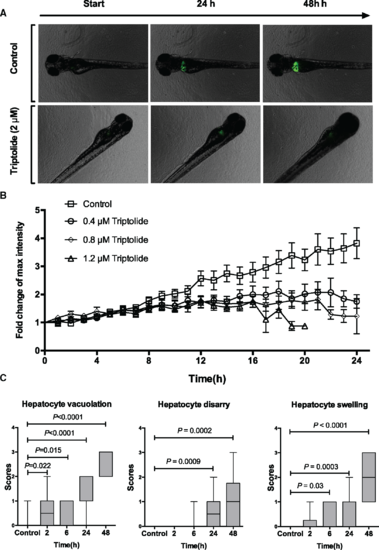
Time-course of triptolide-induced liver injury. A, Fluorescent images of control and TP exposed fish obtained during time-lapse experiments at the indicated time from start of exposure. B, Relative fold change of fluorescent intensity from baseline during TP exposure with the doses indicated (N = 15 larvae for each dose). C, Box plots (min to max) of histology scores of hepatocyte vacuolation, hepatocyte disarray and hepatocyte swelling during exposure to TP (0.8 µM) for the time durations indicated (control N = 17, 2 h N = 10, 6 h N = 9, 24 h N = 16, 48 h N = 20). |
Expression Data
Expression Detail
Antibody Labeling
Phenotype Data
Phenotype Detail
Acknowledgments
This image is the copyrighted work of the attributed author or publisher, and
ZFIN has permission only to display this image to its users.
Additional permissions should be obtained from the applicable author or publisher of the image.
Full text @ Toxicol. Sci.