
Fig. 5
- ID
- ZDB-FIG-171128-3
- Publication
- Crowcombe et al., 2016 - 3D Finite Element Electrical Model of Larval Zebrafish ECG Signals
- Other Figures
- All Figure Page
- Back to All Figure Page
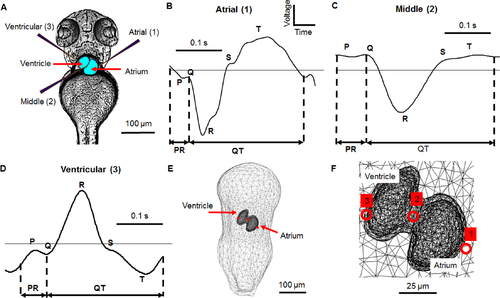
Electrode positions used for electrocardiogram recording with the corresponding measurements and model positions in a 3 dpf zebrafish. A) Processed image in ventral view showing electrodes in different recording positions. Electrode 1 is positioned over the atrium, electrode 2 over the atrioventricular band and electrode 3 over the ventricle, B) A representative atrial recording showing the key ECG features: P wave, QRS complex, T wave, PR interval and QT interval, C) A representative middle recording, D) A representative ventricular recording, E) Expanded ventral view of equivalent electrode positions within the model, F) Close-up ventral view of electrode positions over the heart. The signals from positions 1 and 3 were measured at the same time on the same zebrafish, that from position 2 was measured on a different animal and hence no voltage scale is shown. A positive deflection in the ECG is caused by the depolarisation wave moving towards the recording electrode |