
FIGURE
Fig. 7
Fig. 7
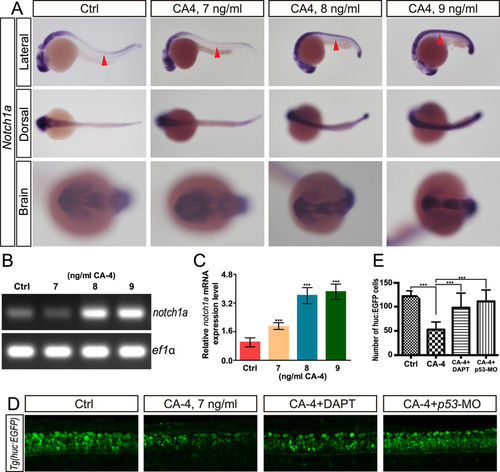
CA-4 treatment caused norch1a up regulation. (A) Whole-mount in situ hybridization analysis of notch1a expression in control embryo and CA-4-treated embryo. Red arrowhead indicates neural tube. (B) RT-PCR analysis of notch1a expression in control embryo and CA-4-treated embryo. (C) Real-time PCR analysis of notch1a expression in control embryo and CA-4-treated embryo. (D) Confocal analysis of CA-4-treated Tg (huc:EGFP) embryo. (E) Statistical analyses of EGFP positive cells in central nervous system of control, CA-4-treated, CA-4 and DAPT treated, and CA-4 treated p53 knockdown embryo. (n = 6), ***P < 0.001. |
Expression Data
Expression Detail
Antibody Labeling
Phenotype Data
Phenotype Detail
Acknowledgments
This image is the copyrighted work of the attributed author or publisher, and
ZFIN has permission only to display this image to its users.
Additional permissions should be obtained from the applicable author or publisher of the image.
Full text @ Sci. Rep.