
Fig. 5
- ID
- ZDB-FIG-171117-15
- Publication
- Kamezaki et al., 2016 - Visualization of Neuregulin 1 ectodomain shedding reveals its local processing in vitro and in vivo
- Other Figures
- All Figure Page
- Back to All Figure Page
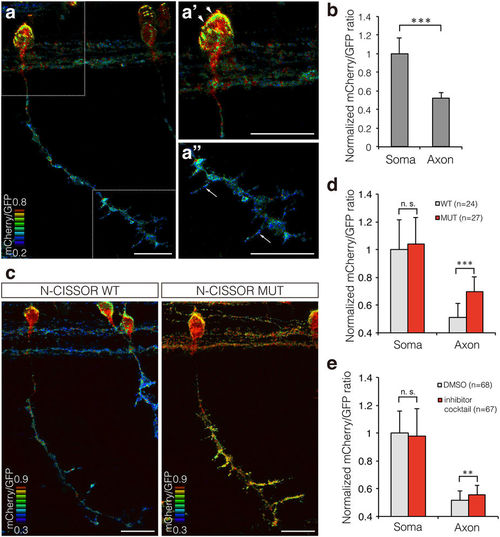
Single-cell analysis of N-CISSOR in zebrafish. (a) A representative mCherry/GFP ratio image of single CaP neurons in Tg (SAIGFF213A; 5 × UAS:N-CISSOR) embryo at 36 hpf. (a’,a”) Magnified views of (a), showing higher ratio in the surface of soma (arrowheads) and axonal branches (arrows). Scale bar: 20 μm. (b) Comparison of mCherry/GFP fluorescence ratios in somas and axons of single or coupled CaP neurons. The mCherry/GFP ratios were calculated for GFP-positive regions and normalized to the mean mCherry/GFP ratio observed in somas. The data are shown as the mean ± SD. P values were calculated by performing Student’s t-test. ***P < 0.0001. (c) Representative mCherry/GFP images of N-CISSOR (WT or MUT)-expressing CaP neurons at 36 hpf. Scale bar: 20 μm. (d) Normalized mCherry/GFP ratios in GFP-positive regions analysed in somas and axons from Tg (SAIGFF213A; 5 × UAS-N-CISSOR) and Tg (SAIGFF213A; 5 × UAS-N-CISSOR MUT) embryos at 36 hpf. The data shown are the mean ± SD. P values were calculated by performing Student’s t-test. ***P < 0.0001. (e) Normalized mCherry/GFP ratios in GFP-positive regions analysed in somas and axons of single or coupled CaP neurons in Tg (SAIGFF213A; 5 × UAS-N-CISSOR) treated with a protease inhibitor cocktail (GM6001 and BACE inhibitor IV) or vehicle control (DMSO), at 25–36 hpf. The data shown are the mean ± SD. P values were calculated by performing Student’s t-test. **P < 0.001; ***P < 0.0001. See also Supplementary Fig. S3 and Supplementary Movie 4. |