
FIGURE
Fig. 1
- ID
- ZDB-FIG-170825-25
- Publication
- Jörg et al., 2015 - Continuum theory of gene expression waves during vertebrate segmentation
- Other Figures
- All Figure Page
- Back to All Figure Page
Fig. 1
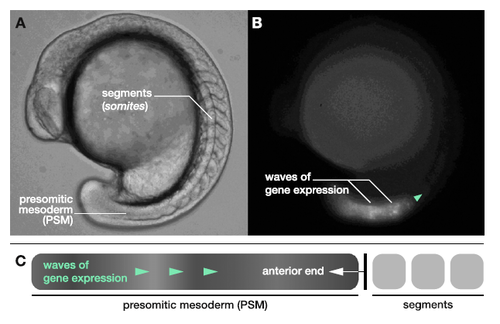
(A) Zebrafish embryo during segmentation of the body axis. (B) The same transgenic embryo as in (A) in the Her1::YFP fluorescence channel highlighting regions of oscillatory gene expression [4]. The green arrow indicates the propagation direction of the waves. (C) A Doppler effect occurs as the anterior end moves into the waves due to PSM shortening. |
Expression Data
Expression Detail
Antibody Labeling
Phenotype Data
Phenotype Detail
Acknowledgments
This image is the copyrighted work of the attributed author or publisher, and
ZFIN has permission only to display this image to its users.
Additional permissions should be obtained from the applicable author or publisher of the image.
Full text @ New J Phys