
Fig. S1
- ID
- ZDB-FIG-170824-37
- Publication
- Quillien et al., 2017 - Robust Identification of Developmentally Active Endothelial Enhancers in Zebrafish Using FANS-Assisted ATAC-Seq
- Other Figures
- All Figure Page
- Back to All Figure Page
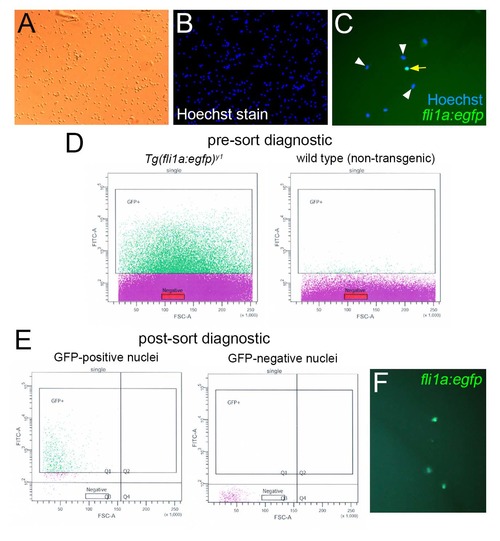
Diagnostic assessment of FANS-assisted ATAC-Seq, relating to Figure 1. (A) Transmitted light image of nuclei prior to fluorescence-based sorting. (B) Nuclei in (A) stained with Hoechst and imaged by fluorescence. (C) Higher magnification image of Hoechststained nuclei isolated from Tg(fli1a:egfp)y1 embryos. Selected GFP-negative nuclei are denoted by arrowheads while a GFP-positive nucleus is indicated by a yellow arrow. (D) Diagnostic fluorescence profile of nuclei from Tg(fli1a:egfp)y1 or non-transgenic wild type embryos prior to sorting. (E) Diagnostic fluorescence profile of GFP-positive and GFP-negative nuclei from Tg(fli1a:egfp)y1 after FANS. Y-axis is fluorescence, X-axis is forward scatter. (F) Fluorescence micrograph of fli1a:egfp-positive nuclei after sorting. |