
Fig. 6
- ID
- ZDB-FIG-170808-1
- Publication
- Pérez Rico et al., 2017 - Comparative analyses of super-enhancers reveal conserved elements in vertebrate genomes
- Other Figures
- All Figure Page
- Back to All Figure Page
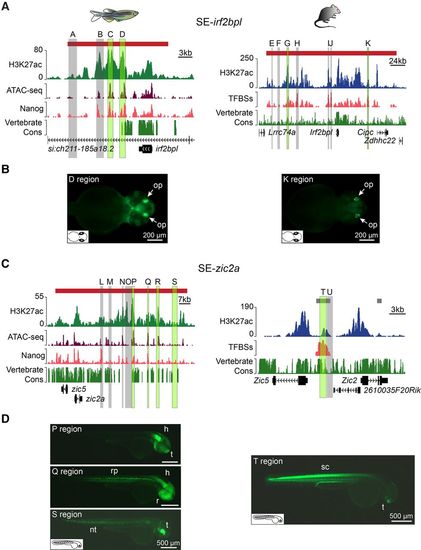
Functional analysis of vertebrate SEs. (A) Genomic context and conservation of the zebrafish (left) and mouse (right) irf2bpl and Irf2bpl loci. Horizontal bars represent SEs (red). Raw H3K27ac ChIP-seq, ATAC-seq, and Nanog ChIP-seq profiles are shown in tag counts (y-axis). The TFBS track represents the TFBS enrichment along the mouse locus. The Vertebrate Cons tracks represent conservation scores calculated by PhastCons. Gray and green highlighted regions correspond to the regions tested in reporter assays. Regions driving specific GFP expression are indicated in green. (B) GFP expression driven by the zebrafish SE-irf2bpl D region (left) and the mouse K region (right) in transgenic zebrafish embryos at 48 hpf. White arrows indicate the olfactory placode (op). (C) Genomic context and conservation of the zebrafish and mouse zic2a and Zic2 loci as described in A. Horizontal bars represent typical enhancers (gray) and SEs (red). (D) GFP expression driven by the zebrafish P, Q, and S regions (left) and the mouse T region (right). (h) Hindbrain, (nt) notochord, (r) retina, (rp) roof plate, (sc) spinal cord, (t) telencephalon. |