
Fig. 2
- ID
- ZDB-FIG-170630-6
- Publication
- Boulanger-Weill et al., 2017 - Functional Interactions between Newborn and Mature Neurons Leading to Integration into Established Neuronal Circuits
- Other Figures
- All Figure Page
- Back to All Figure Page
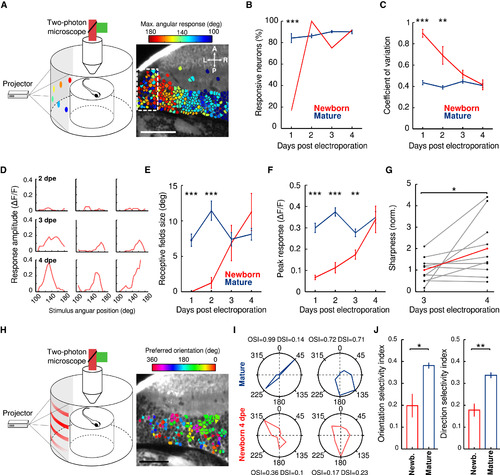
Development of Visually Induced Properties of Newborn-Labeled Neurons (A) Schematic drawing of the recording chamber and the visual stimuli presented to study the visual receptive field of tectal neurons. Examples of light spot stimuli projected on a screen covering a large portion of the larva’s field of view are shown. The light spots are color coded according to their angular position. Right: example of an optical section of the optic tectum showing the functional retinotopic map (note the graded change in colors along the rostro-caudal axis. The neurons are color-coded according to the peak of the neurons’ receptive field. Dashed region indicates the region neighboring the neurogenesis site, containing neurons with weak visual receptive fields and lacking retinotopy organization. Arrows indicate the orientation of the larva: L, left; R, right; A, anterior; P, posterior. The scale bar represents 50 μm. (B) Percentage of visually responsive neurons during development both for newborn (red) and the whole neuronal population (blue) from 1 to 4 dpe (n = 6, 6, 12, and 12 newborn developing neurons and n = 1,883, 2,240, 4,752, and 3,454 neurons from 5, 6, 13, and 10 larvae, respectively). The error bars represent SEM. ∗∗∗p < 0.001. (C) Developmental dynamics of response variability to light spots, quantified as the coefficient of variation, for newborn (blue) and the whole neuronal population (red). The error bars represent SEM. ∗∗∗p < 0.001; ∗∗p < 0.01. (D) Three examples of visual receptive fields (the amplitude of the Ca2+ response with respect to the angular position of the presented light spot within the larva’s field of view), recorded at 2, 3, and 4 dpe. Note the emergence of the receptive fields at 3 dpe. (E and F) Development of the size (E) and peak amplitude (F) of the receptive fields of newborn (red) and whole neuronal population (blue) from 1 to 4 dpe (n = 8 newborn-labeled neurons for each developmental stage and n = 1,565, 2,379, 1,680, and 1,841 functionally mature neurons from 9, 10, 9, and 10 larvae, respectively). The error bars represent SEM. ∗∗∗p < 0.001; ∗∗p < 0.01. (G) Normalized sharpness of the same newborn-labeled neurons imaged at 3 and 4 dpe. Data are normalized to the average value of newborn-labeled neurons at 1 dpe. The red line indicates the average sharpness. ∗p < 0.05. (H) Schematic drawing of the recording chamber and the visual stimuli presented to study the direction and orientation selectivity of tectal neurons. Example of a moving grating projected on a screen covering a large portion of the larva’s field of view. Right: example of an optical section of the optic tectum showing the preferred orientation angle for the direction-selective neurons (direction selectivity index [DSI] > 0.3). Neurons with DSI ≤ 0.3 were not labeled. The scale bar represents 50 μm. (I) Examples of the direction and orientation selectivity (polar plots) of two mature (blue) and two 4-dpe newborn-labeled (red) neurons. The corresponding direction and orientation selectivity indexes (DSI and OSI) are shown above and below the polar graphs. (J) Average of the orientation (left) and direction selectivity (right) indexes for 3- to 4-dpe newborn-labeled (red) and functionally mature (blue) neurons. ∗p < 0.05; ∗∗p < 0.01. The error bars represent SEM. See also Figure S2. |