
Fig. S2
- ID
- ZDB-FIG-170620-30
- Publication
- Pierre et al., 2016 - Generic Theoretical Models to Predict Division Patterns of Cleaving Embryos
- Other Figures
- All Figure Page
- Back to All Figure Page
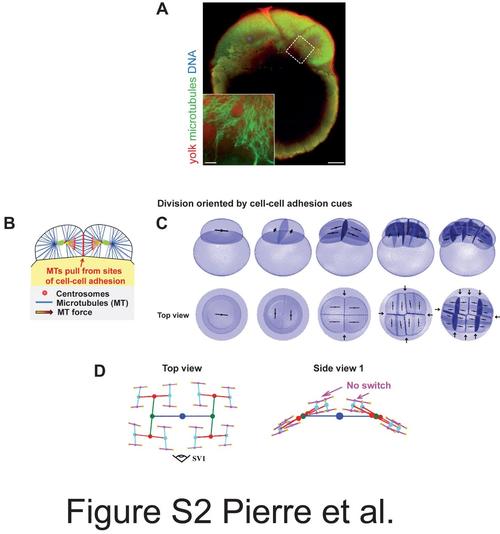
Tests of hypotheses and parameters for zebrafish cleavage patterns. (A) 4-cell stage zebrafish embryo expressing the MT marker ensconsin-GFP, fixed and labeled for actin and DNA, and imaged parallel to the A-V axis. Yolk granules fluoresce in the actin channel, and appear to exclude MTs. Scale bar: 50 μm, 10 μm (inset). (B and C) Predictions of the model, under the hypothesis that MT forces orienting the division axis arise from sites of cell-cell adhesion. Pulling interfaces (arrows) are depicted in darker blue. (D) The predicted cell division orientation lineage under this hypothesis. Note the absence of orientation switch at the 5th Cleavage. |
Reprinted from Developmental Cell, 39, Pierre, A., Sallé, J., Wühr, M., Minc, N., Generic Theoretical Models to Predict Division Patterns of Cleaving Embryos, 667-682, Copyright (2016) with permission from Elsevier. Full text @ Dev. Cell