
Fig. 4
- ID
- ZDB-FIG-170616-16
- Publication
- Dean et al., 2017 - Interrupted Glucagon Signaling Reveals Hepatic α Cell Axis and Role for L-Glutamine in α Cell Proliferation
- Other Figures
- All Figure Page
- Back to All Figure Page
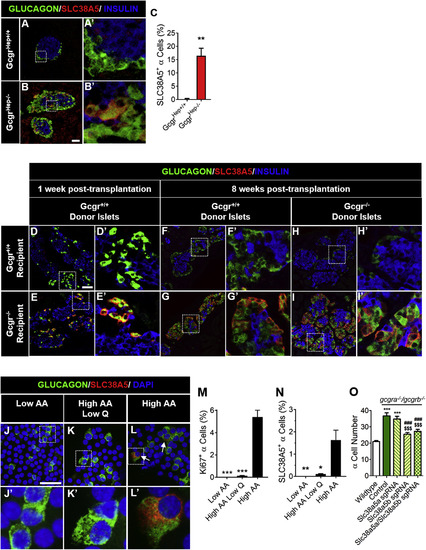
SLC38A5 Is Upregulated in α Cells and Required for Expansion of α Cells in Response to Interrupted Glucagon Signaling (A and B) Representative images of pancreatic islet α cell SLC38A5 expression are shown in (A) control GcgrHep+/+ and (B) GcgrHep−/− mouse pancreas. Glucagon (green), SLC38A5 (red), and insulin (blue) are shown. White scale bars represent 50 μm. White dashed boxes indicate region selected for insets. (C) Quantification of SLC38A5+ α cells in GcgrHep+/+ (white) and GcgrHep−/− (red) mouse pancreas; ∗∗p < 0.01; n = 3. (D–I) Representative images of pancreatic islet α cell SLC38A5 expression in Gcgr+/+ and Gcgr−/− islets from subcapsular renal transplantation into Gcgr+/+ and Gcgr−/− mice (n = 3). SLC38A5 expression is shown at (D and E) 1 week and (F–I) 8 weeks post-transplantation. (J–L) Representative images of pancreatic islet α cell SLC38A5 expression are shown in dispersed islets cultured in in (J) low AA, (K) high AA low Q, or (L) high AA media for 4 days. Glucagon (green), SLC38A5 (red), and DAPI (blue) are shown. White arrows indicate SLC38A5+ α cells. (M and N) Quantification of (M) α cell proliferation and (N) SLC38A5+ α cells in isolated islets cultured in low AA, high AA low Q, or high AA media for 4 days. ∗p < 0.05, ∗∗p < 0.01, and ∗∗∗p < 0.001 versus high AA treated; n = 3. (O) α cell number after knockdown of slc38a5 genes in 6 dpf wild-type (white) and gcgra−/−gcgrb−/− (green, control) zebrafish larvae primary islet. α cell number in slc38a5a single guide RNA (sgRNA)-treated gcgra−/−gcgrb−/− (yellow with green left-hashed), slc38a5b sgRNA-treated gcgra−/−gcgrb−/− (yellow with green right-hashed), or slc38a5a/slc38a5b sgRNA-treated gcgra−/−gcgrb−/− (yellow with green double-hatched) are also shown. ∗∗∗p < 0.001 versus wild-type, ###p < 0.001 versus control gcgra−/−gcgrb−/−, and $$$p < 0.001 versus slc38a5a sgRNA-treated gcgra−/−gcgrb−/−; n = 7–23. Data are mean ± SEM. |
| Fish: | |
|---|---|
| Knockdown Reagents: | |
| Observed In: | |
| Stage: | Day 6 |
Reprinted from Cell Metabolism, 25, Dean, E.D., Li, M., Prasad, N., Wisniewski, S.N., Von Deylen, A., Spaeth, J., Maddison, L., Botros, A., Sedgeman, L.R., Bozadjieva, N., Ilkayeva, O., Coldren, A., Poffenberger, G., Shostak, A., Semich, M.C., Aamodt, K.I., Phillips, N., Yan, H., Bernal-Mizrachi, E., Corbin, J.D., Vickers, K.C., Levy, S.E., Dai, C., Newgard, C., Gu, W., Stein, R., Chen, W., Powers, A.C., Interrupted Glucagon Signaling Reveals Hepatic α Cell Axis and Role for L-Glutamine in α Cell Proliferation, 1362-1373.e5, Copyright (2017) with permission from Elsevier. Full text @ Cell Metab.