
Fig. 4
- ID
- ZDB-FIG-170614-25
- Publication
- Miles et al., 2017 - A role for planar cell polarity during early endoderm morphogenesis
- Other Figures
- All Figure Page
- Back to All Figure Page
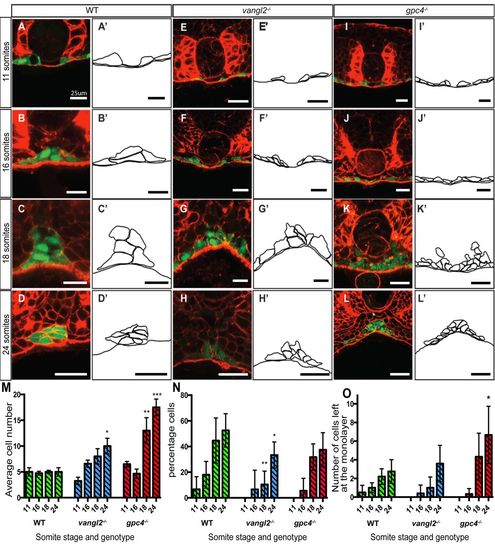
Midline aggregation of endodermal cells in wild-type and PCP mutant lines. (A-L). Confocal images of sections stained with Rhodamine-Phalloidin to show F-actin (red) at 11 somites, 16 somites, 18 somites, and 24 somites. Endoderm labelled in green by Tg(sox17:EGFP). Vibratome sections are in the region of the trunk endoderm to control for A-P position. (A′-L′) Schematic representations of the endoderm at each stage. (A-D) Wild-type embryos. (E-H) vangl2−/− embryos, and (I-L) gpc4−/− embryos, showing a wider endodermal region and an increase in endodermal cell number. Scale bar: 25 μm. (M) Mean cell number at the dorsal midline from 11 somites to 24 somites of wild-type (green bars), vangl2−/− (blue bars), and gpc4−/− (red bars) embryos. (N) Percentage of endodermal cells that have left the monolayer in wild-type (green bars), vangl2−/− (blue bars), and gpc4−/− (red bars) embryos. (O) Total number of endodermal cells that have left the monolayer in wild-type (green bars), vangl2−/− (blue bars), and gpc4−/− (red bars) embryos (n=2-8). Error bars represent s.e.m. Asterisk represents significant as determined by t-test, *P≤0.05, **P≤0.01, ***P≤0.001. |