
Fig. 4
- ID
- ZDB-FIG-170607-9
- Publication
- Umans et al., 2017 - CNS angiogenesis and barriergenesis occur simultaneously
- Other Figures
- All Figure Page
- Back to All Figure Page
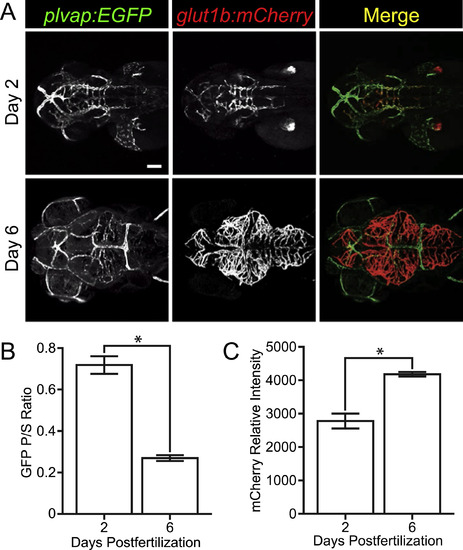
Visualization of blood-brain barrier maturation. (A) Representative images of plvap:EGFP;glut1b:mCherry double transgenic embryos on day 2 and 6 dpf. Green and red channels were captured using the same intensities on day 2 and day 6 to illustrate the decrease in GFP expression and the increase in mCherry expression. Scale bar (A, top left image) is 50 µm for all images. (B) GFP fluorescence intensity was measured in brain parenchymal (P) and brain surface (S) endothelial cells (n=18 per group) and the ratio of parenchymal/surface intensity (GFP P/S Ratio) was plotted. Note the significant decrease of GFP expression in parenchymal endothelial cells over time. (C) Relative mCherry fluorescence intensity was measured in parenchymal endothelial cells (n=18 per group) and plotted. Note the significant increase in mCherry expression over time. See volume rendered Video 3 to better visualize surface and parenchymal expression of GFP and mCherry. Error bars represent ±S.E.M.; * p<0.0001, Unpaired t-test. |
| Genes: | |
|---|---|
| Fish: | |
| Anatomical Term: | |
| Stage Range: | Long-pec to Day 6 |
Reprinted from Developmental Biology, 425(2), Umans, R.A., Henson, H.E., Mu, F., Parupalli, C., Ju, B., Peters, J.L., Lanham, K.A., Plavicki, J.S., Taylor, M.R., CNS angiogenesis and barriergenesis occur simultaneously, 101-108, Copyright (2017) with permission from Elsevier. Full text @ Dev. Biol.