
Fig. 1
- ID
- ZDB-FIG-170519-4
- Publication
- Roy-Carson et al., 2017 - Defining the transcriptomic landscape of the developing enteric nervous system and its cellular environment
- Other Figures
- All Figure Page
- Back to All Figure Page
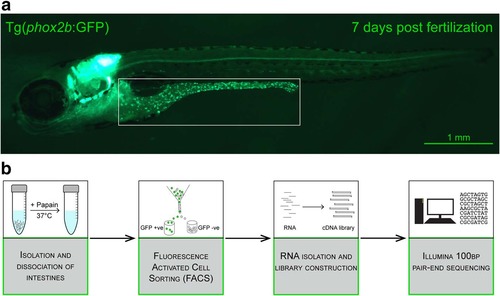
Image and flow chart illustrating source of GFP labeled cells, sample preparation and bioinformatics analysis. a Image of a 7 days post fertilization (dpf) zebrafish larvae of the transgenic line, Tg(phox2b:EGFP). The boxed area shows the intestine with GFP-positive enteric neurons (green dots). b Schematic diagram illustrating the experimental approach. Intestines were dissected out to avoid contamination with GFP-positive cells expressing phox2b in the hindbrain or the spinal cord. The intestines were dissociated using papain digestion followed by fluorescent activated cell sorting (FACS). RNA isolated from the sorted cell populations was used to construct cDNA libraries. Raw reads from Illumina sequencing were processed and analyzed using various bioinformatics analyses programs |