
Fig. 5
- ID
- ZDB-FIG-170418-7
- Publication
- Schaefer et al., 2015 - Molecular and functional interactions between AKT and SOX2 in breast carcinoma
- Other Figures
- All Figure Page
- Back to All Figure Page
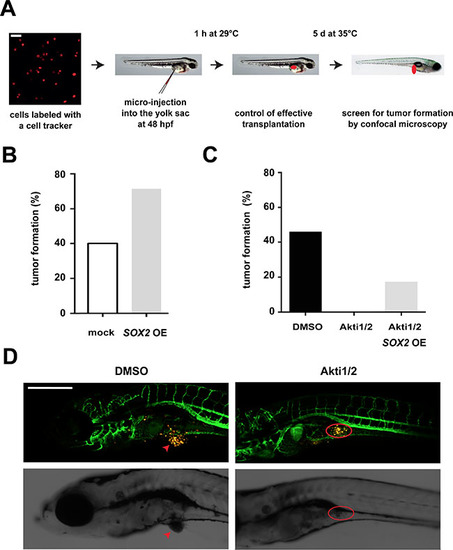
Influence of the AKT/SOX2 axis on in vivo tumorigenicity. (A) Schematic illustration of the zebrafish xenotransplantation procedure and assay. Scale bar: 50 μm. (B) SOX2 overexpression facilitates in vivo tumor induction. Shown are percentages of fish with tumors upon transplantation with SOX2-overexpressing versus control T47D cells (75 cells per fish and 10 or more fish for each condition). (C) AKT kinase inhibition by Akti1/2 (5 μM) prevents tumor formation in T47D xenotransplanted fish. However, tumor formation in AKT inhibitor-treated embryos is partially restored by concomitant SOX2 overexpression. At least n = 10 embryos were analyzed per group. (D) Representative confocal pictures of T47D-induced tumor formation and AKT inhibitor effects. Note that in mock-treated control animals T47D cells (yellow) grow out to form a solid tumor mass (arrow, left), whereas dispersed T47D cells persist in the yolk sac of Akti1/2-treated fish (red circle, right). Transgenic fli:eGFP zebrafish are used to allow visualization of interactions with host vessels. Scale bar: 500 μm. |
| Gene: | |
|---|---|
| Fish: | |
| Condition: | |
| Anatomical Term: | |
| Stage: | Day 5 |