
Fig. 2
- ID
- ZDB-FIG-170313-7
- Publication
- Xu et al., 2017 - In vivo Imaging of Mitochondrial Transport in Single-Axon Regeneration of Zebrafish Mauthner Cells.
- Other Figures
- All Figure Page
- Back to All Figure Page
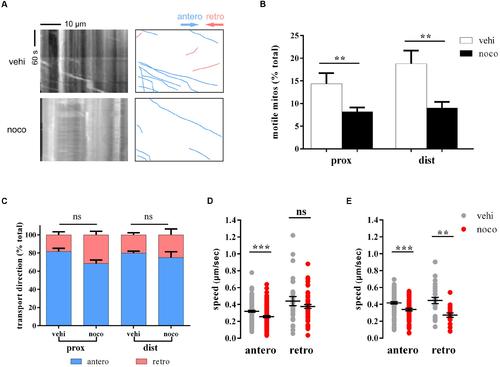
Nocodazole treatment disrupts mitochondrial trafficking. (A) The kymographs (left) depict moving mitochondria in vehicle- (top) and nocodazole-treated (below) zebrafish larvae at 6 dpf. Right kymographs are hand-drawn traces, and the diagonal lines represent moving mitochondria (anterograde, blue lines; retrograde, pink lines). (B–E) Mitochondrial motility (B), transport direction (C; anterograde, blue; retrograde, pink), and speed (D, in the area of proximal axons; E, in the a rea of distal axons) in vehicle- (DMSO; gray) and nocodazole- (red) treated zebrafish larvae at 6 dpf. ∗∗p < 0.01, ∗∗∗p < 0.001. Error bars represent SEM. |