
Fig. 5
- ID
- ZDB-FIG-170208-51
- Publication
- Davey et al., 2016 - PCP Signaling between Migrating Neurons and their Planar-Polarized Neuroepithelial Environment Controls Filopodial Dynamics and Directional Migration
- Other Figures
- All Figure Page
- Back to All Figure Page
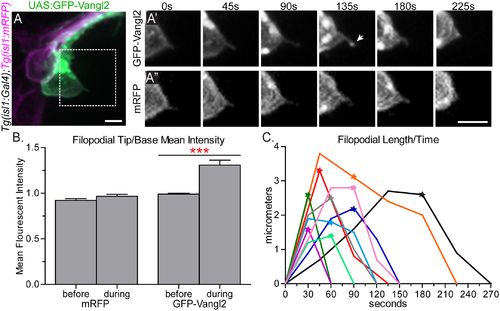
GFP-Vangl2 is enriched to the tip of retracting FBMN filopodia. (A) Live confocal image of a single GFP-Vangl2 expressing FBMN (green) in a Tg(isl1:mRFP) (magenta) 24 hpf embryo. Scale bar: 10 μm. (A',A'') Magnified views of the boxed region in A of the individual channels, GFP-Vangl2 and Tg(isl1:mRFP) respectively, at the time points indicated. The arrow in E' indicates enrichment of GFP-Vangl2 at the filopodial tip. Scale bar: 10 μm. (B) Quantitation of filopodia tip/base mean fluorescent intensity ratio for mRFP and GFP-Vangl2 at the time-point before and during GFP-Vangl2 enrichment. Before enrichment the mean fluorescent intensity ratio of GFP and mRFP at the filopodia tip versus the filopodia base is approximately 1 (N = 9 filopodia). During the enrichment event this ratio for GFP-Vangl2 is 1.31 while the ratio remains close to 1 for mRFP (N = 12 filopodia). (C) Plot showing the change in filopodial length over time for 10 filopodia. The stars indicate the time-point that GFP-Vangl2 is enriched at each filopodium tip. The black trace corresponds to the filopodium in A',A''. Graph represents data as mean ± SEM. ***p<0.001; Significance was determined using an unpaired, two-tail t-test with Welch's correction. |