
Fig. 1
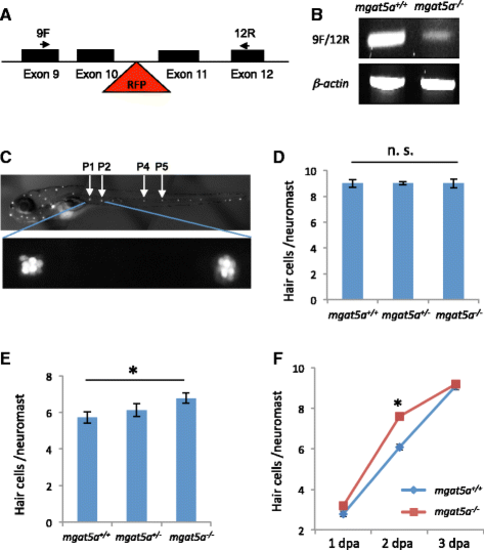
mgat5a mn0157gt mutation enhances hair cell regeneration. a Schematic diagram of the gene-trap mutation in the mgat5a gene. Exons are indicated by solid boxes. The red triangle indicates the site of the gene trap insertion. Arrows indicate the locations of primers used for mutation detection. b RT-PCR analysis of mgat5a expression in the wild-type (WT) and homozygous mutant embryos. B-actin is used as internal reference. c Fluorescent images of a wild-type embryo at 5 dpf stained with Yo-Pro-1. Upper pattern shows the distribution of neuromasts. The neuromasts used for hair cell counting are labeled. Bottom panel shows a higher magnification of P1 and P2 neuromasts. d Normal hair cell development in mgat5a mn0157gt mutants. e Enhanced hair cell regeneration in mgat5a mn0157gt mutants. f Time-course analysis for hair cell regeneration in mgat5a mn0157gt mutants. Graphs d, e, and f show the data from analyzing 24–32 embryos that were generated from a pairwise incross of heterozygotes and genotyped afterwards for genotype-phenotype correlation. Error bars show the s.e.m. The difference between wild type (WT) and homozygotes is not significant (n. s.) in d (p = 0.83), but significant in e (p = 0.02) and in f at 2 dpa (p < 0.001) |
| Fish: | |
|---|---|
| Condition: | |
| Observed In: | |
| Stage: | Days 7-13 |