
Fig. S3
- ID
- ZDB-FIG-161117-7
- Publication
- Brunt et al., 2016 - Differential effects of altered patterns of movement and strain on joint cell behaviour and skeletal morphogenesis
- Other Figures
- All Figure Page
- Back to All Figure Page
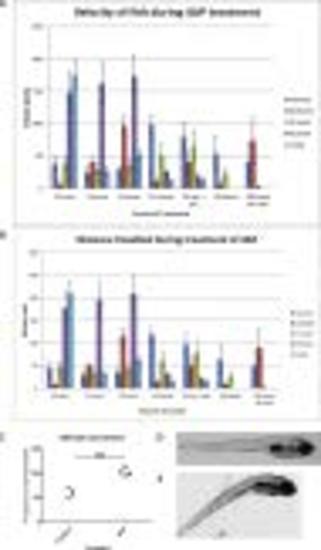
A) Graph showing average velocity of tracked fish treated with doses of 4AP or in the case of control DMSO alone. Tracks were taken from 10 fish per dose and error bars represent 95% confidence intervals. (n = 10) B) Graph to show average distance travelled per fish when tracked over a period of 6 minutes treated with doses of 4AP or in the case of control DMSO alone. Tracks were taken from 10 fish per dose and error bars represent 95% confidence intervals (n = 10). C) Number of mouth openings per minute in control and fish treated with 0.5mM 4AP for 3 h. Measurements taken from 4 fish per treatment. Statistical test is a 2 tailed students t-test P < 0.01. (n = 4) D) Brightfield image of a control larva at 5 dpf. E) Brightfield image of a representative larva treated with 0.1mM 4AP from 3–5 dpf. |