
Fig. 6
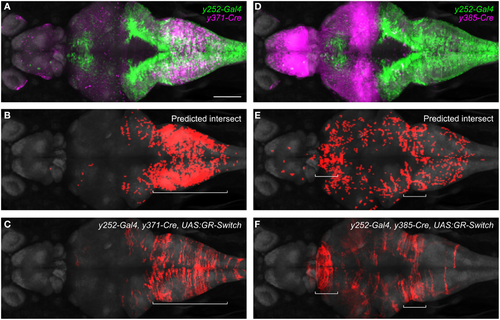
Intersectional control of reporter gene expression in neurons expressing both Gal4 and Cre. (A) Expression patterns of y252-Gal4 and y371-Cre superimposed using the brain browser. Scale bar 100 µm. (B) Predicted region of co-expression for y252 and y371 based on co-localization of strongly fluorescent pixels (red). (C) Actual region of co-expression of Gal4 and Cre in y252-Gal4, y371-Cre, UAS:GR-Switch embryos. Both predicted and actual expression is primarily confined to the median and caudal medulla. (D-F) Similar analysis using y252-Gal4 and y385-Cre in which very strong Cre expression is detected in the forebrain, and weaker Cre expression is observed in the medulla. Both predicted and actual expression is seen in these regions, along with sparse labeling in additional brain regions. |