
Fig. 4
- ID
- ZDB-FIG-160811-34
- Publication
- Antinucci et al., 2016 - A crystal-clear zebrafish for in vivo imaging
- Other Figures
- All Figure Page
- Back to All Figure Page
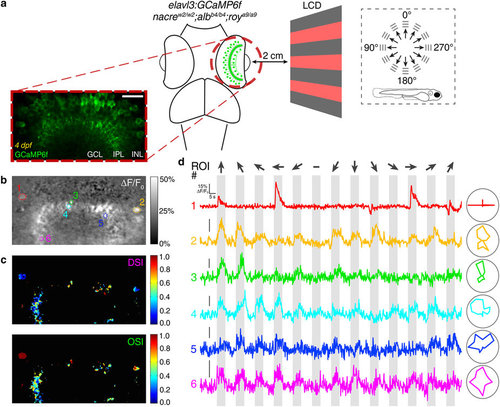
Calcium imaging of visually evoked neural activity in the retina using crystal. (a) Two-photon functional calcium imaging of amacrine cells and ganglion cell dendrites expressing GCaMP6f (green) in 4 dpf crystal Tg(elavl3:GCaMP6f) larvae (n = 8 larvae). Distance of the eye from LCD screen is 2 cm. Recordings are performed from 2-4 Z-planes (approximately 20 µm total volume thickness) at 4 Hz image acquisition rate. Dashed box shows the angles of moving gratings relative to zebrafish larva orientation. INL, inner nuclear layer; GCL, ganglion cell layer; IPL, inner plexiform layer. Scale bar is 20 µm. (b,c) Mean ΔF/F0 image of a representative calcium recording (b) followed by voxel-wise analysis of direction and orientation selectivity of visual responses (c). DSI, direction selectivity index; OSI, orientation selectivity index. (d) ΔF/F0 calcium traces during a representative tuning experiment from the 6 selected regions of interest (ROIs) shown in (b). Polar plots showing the tuning profiles (i.e., integral ΔF/F0 responses to different stimuli) of individual ROIs are reported on the right. Stimulus epochs are shown in grey. Dark arrows indicate the different directions of gratings motion. The blank-screen null condition is indicated by a ‘-’ sign. |
| Fish: | |
|---|---|
| Observed In: | |
| Stage: | Day 4 |