
Fig. 7
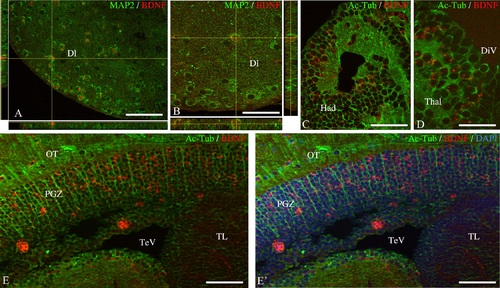
Transverse sections of adult zebrafish brain showing co-expression of bdnf mRNA with neuronal markers. Orthogonal projections of Z-stacks from telencephalon (11 sections of 0.5 µm) evidencing the expression of bdnf (red) in neurons identified by MAP2 protein (green) (A and B). Double staining for bdnf mRNA (red) and acetylated-tubuline (green) in the habenula (C), the thalamus (D) and the optic tectum (E-E′). In E′, cell nulei are labeled in blue with DAPI. Dl: lateral zone of the dorsal telencephalon; Had: dorsal habenular nucleus; OT: optic tectum; PGZ: periventricular gray zone of the optic tectum; TelV: telencephalic ventricle; Thal: thalamus; TL: torus longitudinalis. A, B, C and D were obtained with the confocal microscope. E and E′ were obtained with the Apotome. Scale bar: 50 µm in E and E′; 40 µm in A and C; 25 µm in B and D. |