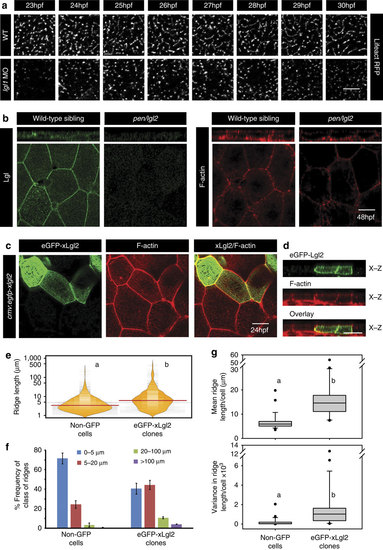
Lgl regulates the length of microridges by promoting their fusion.Live time-lapse imaging of microridge elongation (a) in clones expressing lifeActRFP under CMV promoter in wild-type and lgl1 morphant embryos during 23-30 hpf. Immunolocalization of Lgl and F-actin at the basolateral domain in wild-type and pen/lgl2 mutant at 48 hpf (b). Confocal images of immunostaining using anti-GFP antibody and phalloidin in wild-type embryos-injected with eGFP-xLgl2 construct under CMV promoter at 24 hpf (c) and their orthogonal sections (d). Visualization of the distribution of the ridge lengths and medians in eGFP-xLgl2 expressing clones and surrounding non-GFP cells using bean plots (e). The frequency distribution of ridges in short (0-5 µm), intermediate (5-20 µm), long (20-100 µm) and very long (>100 µm) categories (f). The box-whisker plots (g) represent the distributions of means and variances per cell in eGFP-xLgl2 expressing clones and surrounding non-GFP cells. Data presented in e-g is based on ridge-length measurements done on phalloidin stainings performed in the eGFP-xLgl2 injected embryos at 24 hpf. In bean plots (e) and box-whisker plots (g) the alphabets ‘a’ and ‘b’ represent significant difference in median values at P<0.05 (pairwise multiple comparison using Dunn’s Method). Error bars in f represent the s.d. Scale bars in a-d correspond to 10 µm.
|
