
Fig. 3
- ID
- ZDB-FIG-160630-4
- Publication
- Wang et al., 2016 - Extracellular interactions and ligand degradation shape the nodal morphogen gradient
- Other Figures
- All Figure Page
- Back to All Figure Page
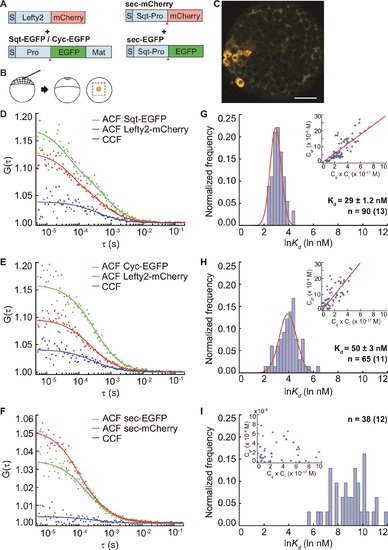
FCCS measurements reveal that Lefty has higher affinity to Sqt compared to Cyc. (A) Constructs used for injection. S, signal peptide; Pro, pro-domain; Mat, mature-domain. Red arrows indicate the convertase cleavage sites. (B) Injection procedure. (C) Confocal image of an injected embryo at 30% epiboly showing the expression patterns of the fusion proteins. Scale bar represents 50 µm. (D, E, F) Representative auto- and cross-correlation functions (ACF; CCF) and fittings. (G, H, I) Individual Ln(Kd) frequency histogram and Gaussian fits (red curve). Inset, concentration plot and linear regression (red line). X axis, concentration of bound protein (Cgr(x10-9 M)); Y axis, products of concentrations of free proteins (Cg x Cr(x10-17 M)). n = number of data points (i.e., number of embryos). |