
Fig. S3
- ID
- ZDB-FIG-160607-13
- Publication
- Becker et al., 2016 - Intronic Flk1 Enhancer Directs Arterial-Specific Expression via RBPJ-Mediated Venous Repression
- Other Figures
- All Figure Page
- Back to All Figure Page
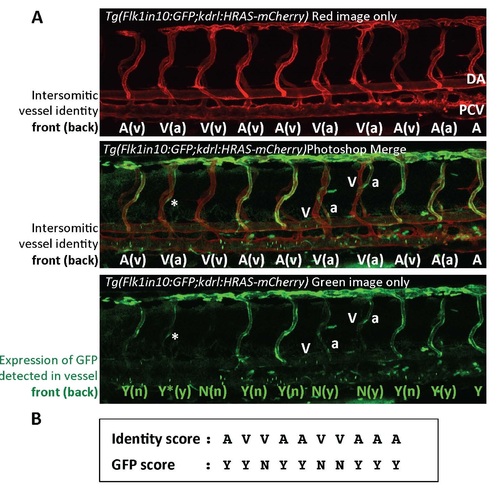
A. Detailed example of the analysis of arterial:venous identity of intersegmental sprouts used in Figure 2. Pictures denote single image of a representa+ve 72 hpf tg(Flk1in10:GFP;kdrl:HRASmCherry) embryo. Top panel denotes mCherry image only, in which the panvascular kdrl:HRASmCherry transgene is expressed in all intersegmental vessels as well as the dorsal aorta (DA) and posterior cardinal vein (PCV). Using this image we were able to assess the identity of each intersegmental vessel by whether it connects to the DA (arterial) or PCV (venous). The transparency of the embryo meant that we image two intersegmental vessels for each segment, one in the foreground denoted by UPPERCASE and the other in the background, denoted by bracketed lowercase. The middle image denotes both GFP and mCherry expression, and the bottom image just GFP expression. For each intersegmental vessel detected by kdrl:HRASmCherry expression, we scored whether GFP expression was detected (Y) or not (N). Vessels in foreground recorded as UPPERCASE, vessels in background as bracketed lowercase. * represents GFP in one cell, still recorded as GFP expression (Y) by our method. B. Creation of identity and GFP score used to create the bar chart in Figure 2. Records only foreground intersegmental identity and GFP expression. |