
Fig. 2
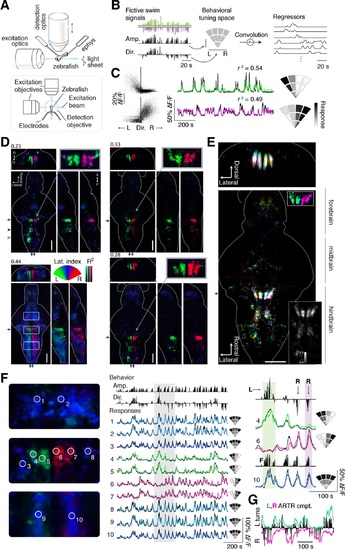
Whole-brain analysis identifies neural structures correlated with turning behavior.(A) Schematic of experimental paradigm for fictive swimming combined with light-sheet imaging (′Materials and methods′). (B) Schematic of analysis technique. Left: First, fictive swim signals are converted into measures of swim amplitude (′Amp′) and turning direction (′Dir′ for laterality). Middle: Next, amplitude and laterality are mapped onto the vertical and horizontal axes of a 2D space. This space is tiled with 12 basis functions, each representing a region in this 2D behavior space, now defined in polar coordinates (′Materials and methods′). Contours are shown for clarity; actual basis functions overlap by 50%. Right: The signal from each bin is convolved with an impulse response function to generate a regressor; an example subset of regressors is shown. (C) Brain activity is regressed against the regressors constructed in (B) to generate a behavioral tuning function for every voxel. Voxels of two example neurons are shown here. Left, relationship between turn laterality and neural response for the two example neurons, each dot is a time point. Middle, time series from the same two example neurons. Black line, ΔF/F; colored line, prediction of best-fitting model (see panel B). Right, behavioral tuning for the same two neurons, given by regression coefficients, using the analysis described in panel B; grayscale ranges from 10th to 90th percentile of the coefficient weights. (D) Behavioral tuning maps across the brain derived from fitting every voxel with the regressors described in panel B, for four representative fish. Calcium indicators are either localized in cytoplasm (left two fish) or in the nucleus (right two fish). The dorsal view is a maximum intensity projection over the whole brain; the side and front views are taken from a maximum intensity projection of 21 slices (~10 µm) along the medial-lateral axis and rostral-caudal axis, respectively. Numbers above each panel indicate the R2 value at which the color map saturates (maximum R2 value is higher), color maps start at R2 = 0. Arrows in each panel represent the centroid position of these slices for the frontal view (top) or side view (right). Solid arrowhead: diffusive correlated region in rhombomeres 4-6. Open arrowhead, inferior olive. Scale bar, 100 µm. D, dorsal; V, ventral; A, anterior; P, posterior. (E) Registered map from seven different fish (nuclear localized GCaMP6f) to a standard brain. Each fish is encoded by a different color; brightness represents R2. Bottom, top-down maximum intensity projection (along the dorsal-ventral axis). Top, front projection as in d, with the centroid of the slice indicated by the arrow in bottom panel. Top right inset, ARTR region across fish in the standard brain, but with color representing laterality as in panel d, showing consistent tuning across animals. Bottom right inset, a measure of stereotypy in location of functionally identified neurons across the 7 fish. Intensity represents the standard deviation divided by the mean of R2 (thresholded at 0.04). Scale bar, 100 µm. (F) Example ΔF/F traces from regions of interest (ROIs) in panel (D) (left bottom, white boxes). Left, top to bottom: midbrain, ARTR, and caudal hindbrain. Middle, top, signals of swim amplitude (Amp.) and turn laterality (Dir.). Black bars represent several individual swim events. Bottom, ΔF/F from ROIs in the left panels. Right, enlarged view of gray region in middle panel. L,R,F stand for left turns, right turns and swim amplitude, respectively. Responses from ROIs 1-3 and 8-10 show tuning to swim amplitude; ROIs 4,5 to left turns, and ROIs 6,7 to right turns. (G) In addition to single cells, activity of left and right populations derived with ICA (Figure 2-figure supplement 1C-E; bottom-right fish of Figure 2D) tracks turning behavior. |