
FIGURE
Fig. 6
- ID
- ZDB-FIG-160504-9
- Publication
- Cano-Nicolau et al., 2016 - Estrogenic Effects of Several BPA Analogs in the Developing Zebrafish Brain
- Other Figures
- All Figure Page
- Back to All Figure Page
Fig. 6
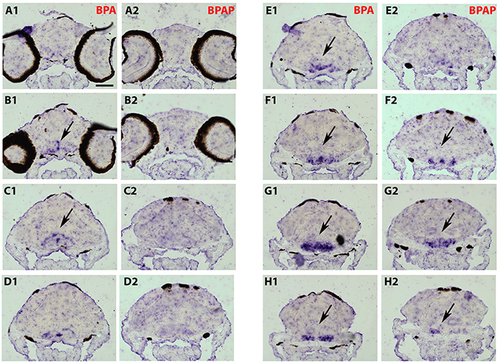
Distribution of cyp19a1b transcripts in a 7-dpf old zebrafish brain after treatment with BPAP (A2-H2) and compared to a BPA-treated brain (A1-H1). Images of transverse sections through the rostrocaudal axis of brains. Arrowheads highlight areas of labeling. For all images, dorsal is to the top. Scale bar = 50 µm. |
Expression Data
Expression Detail
Antibody Labeling
Phenotype Data
Phenotype Detail
Acknowledgments
This image is the copyrighted work of the attributed author or publisher, and
ZFIN has permission only to display this image to its users.
Additional permissions should be obtained from the applicable author or publisher of the image.
Full text @ Front. Neurosci.