
Fig. 7
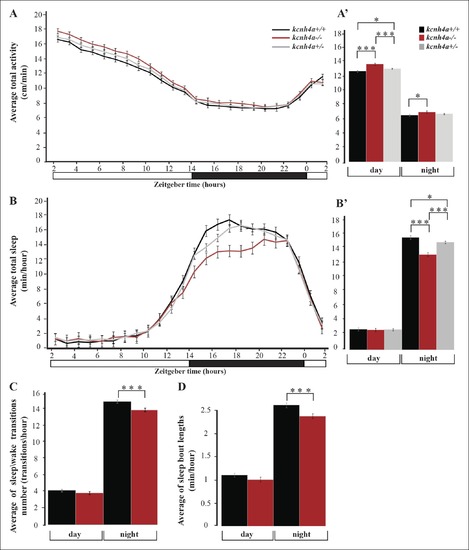
Sleep time and quality are reduced in kcnh4a-/- larvae during the night. (A) The locomotor activity of kcnh4a-/- (n=85), kcnh4a+/- (n=208), and kcnh4a+/+ (n=98) is shown. kcnh4a-/- larvae exhibit increased locomotor activity compared with kcnh4a+/- and kcnh4a / under LD conditions. (B) kcnh4a-/- larvae showed a significant reduction in sleep time compared with kcnh4a+/- and kcnh4a+/+ during the night. Bar charts represent the average total locomotor activity (A′) and sleep time (B′) for each genotype. Values are represented as means ± SEM. (C,D) The number of sleep\wake transitions (C) and the length of sleep bout (D) are decreased in kcnh4a-/- larvae during the night. Recording of locomotor activity and sleep was performed in 6 dpf larvae continuously during 24 hr under a 14 hr light/10 hr dark cycle (white and black bars represent light and dark periods, respectively, *p<0.05, **p<0.01, ***p<0.0001, with repeated measures of ANOVA). |
| Fish: | |
|---|---|
| Observed In: | |
| Stage: | Day 6 |