
Fig. 1
- ID
- ZDB-FIG-160412-6
- Publication
- Chen et al., 2016 - Initiation of cyp26a1 Expression in the Zebrafish Anterior Neural Plate by a Novel Cis-Acting Element
- Other Figures
- All Figure Page
- Back to All Figure Page
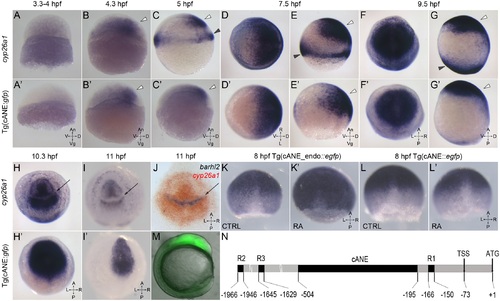
Characterization of cANE activity as an early neural plate specific enhancer.(A-I,A′-I′) Compared expression patterns of cyp26a1 (A-I) and egfp driven by cANE (A′-I′) during early embryonic development. (J) Double in situ hybridization showing barhl2 expression domain (blue) exactly filling the gap in the cyp26a1 expression domain (red). (A,B,C,E,G,A′,B′,C′,E′,G′) are lateral views. (d,f,h,I,D′,f′,h′,I′) are animal pole views. White arrowheads: anterior neural plate. Black arrowheads: blastoderm marginal zone. Arrows in (H-J): gap in the anterior neural plate domain of cyp26a1 expression. All stages are indicated in the pictures. (k,k′,l,l′) The effect of 100 nM retinoic acid (RA) treatment between 2,5 hpf and 8,5 hpf on on stable transgenic cANE_endo:::egfp (K-K′) and cANE::egfp (L-L′) expression. (M) EGFP fluorescence in a 12 hpf stable transgenic cANE:::egfp embryo. Lateral view with dorsal to the left. (N) Schematic representation of cANE and all three reported retinoic acid responsive elements (R1, R2, R3) identified previously. cANE is located from -504 bp to -195 bp relative to cyp26a1 ATG codon. An: animal, Vg: vegetal; V: ventral; D: dorsal, A: anterior, P: posterior, L: left, R: right, CTRL: control embryo, RA: retinoic-acid treated embryo. |